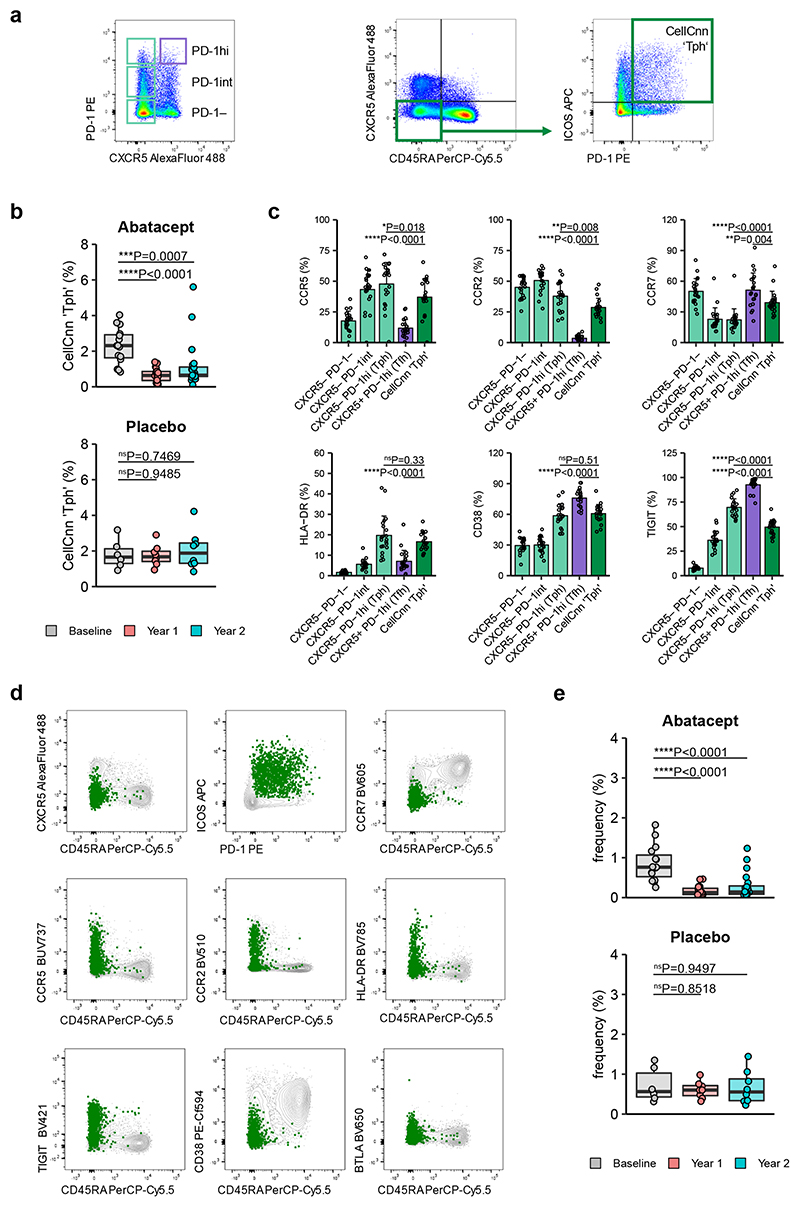
Figure 6. Tph cells identified through CellCnn display marker expression consistent with a Tph profile.
Frozen PBMC samples from recent onset T1D patients that received Abatacept or placebo were thawed and analysed by flow cytometry for Tph and Tfh markers. (a) Representative gating strategy for CXCR5 vs PD-1 populations (left) and Tph previously identified through CellCnn analysis (right). (b) Collated data for frequency of cells in the CellCnn ‘Tph’ gate. (c) Expression of Tph markers on “Tph” identified by CellCnn compared with classically identified CXCR5−PD1hi Tph gated as shown in (a). Data was obtained from baseline samples and shown are mean + SD. (d, e) CellCnn analysis of samples identifies a cluster of Tph-phenotype cells. Shown is expression of indicated markers within cluster (green) and all cells (grey) of representative sample (d) and frequency of cluster-specific cells in Abatacept- or Placebo-treated T1D patients (e). (b, e) Abatacept, n=15 (Baseline) or 20 (Year 1 and Year 2) patients; Placebo, n=6 (Baseline) or 8 (Year 1 and Year 2) patients; (c) n=21 patients. In (b) and (e) boxplots are shown with black horizontal line denoting median value, while box represents interquartile ranges (IQR, Q1-Q3 percentile) and whiskers show minimum (Q1– 1.5 * IQR) and maximum (Q3 + 1.5 * IQR) values. Two-tailed Mann-Whitney U test; ****, p < 0.0001; ***, p < 0.001; **, p < 0.01; *, p < 0.05; ns, not significant.

