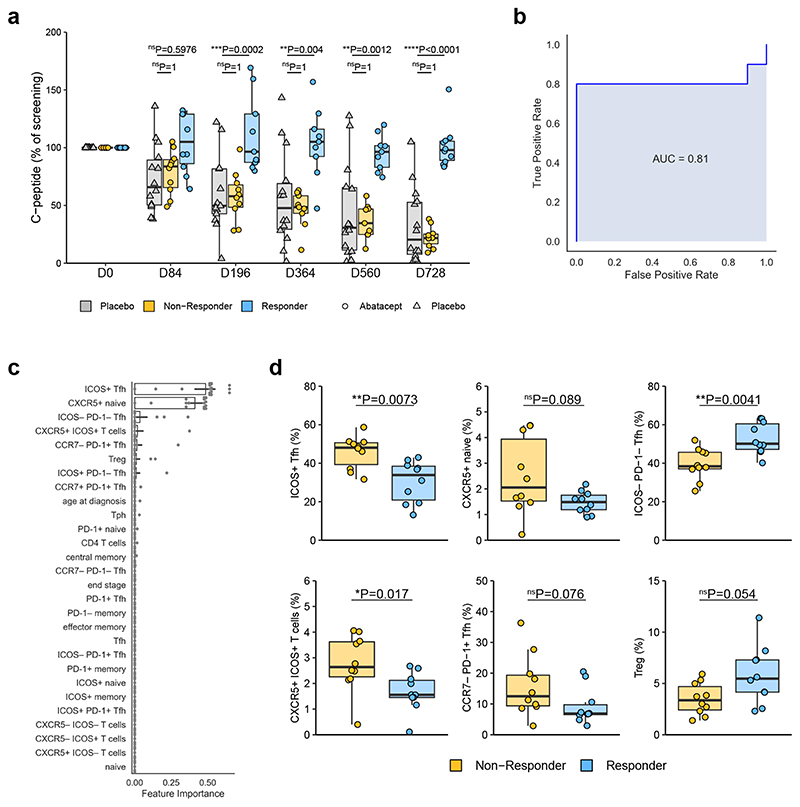
Figure 7. Baseline Tfh phenotype is associated with clinical response to Abatacept.
(a) C-peptide AUC (as % of screening C-peptide AUC) of placebo treated and top 10 (at day 728) responder and non-responder Abatacept-treated patients. Responder, n=9 (D196, D364, D560) or 10 (all other time points) patients; Non-Responder, n=9 (D364, D560) or 10 (all other time points) patients; Placebo, n=13 (D196) or 14 (all other time points) patients. (b) A gradient boosting model was constructed using nested leave-one-out cross validation to predict clinical response following Abatacept treatment. ROC curve of the predictive model is shown. (c) Features ranked by importance for predicting clinical response following Abatacept treatment. Bar shows mean and black lines represent 95% confidence intervals, n=20 patients. (d) Frequencies of indicated flow cytometry gated populations at baseline (n=10 patients in each group). In (a) and (d) boxplots are shown with black horizontal line denoting median value, while box represents interquartile ranges (IQR, Q1-Q3 percentile) and whiskers show minimum (Q1– 1.5 * IQR) and maximum (Q3 + 1.5 * IQR) values. (a) Two-way ANOVA with Bonferroni correction; (d) Two-tailed Mann-Whitney U test; ****, p < 0.0001; ***, p < 0.001; **, p < 0.01; *, p < 0.05; ns, not significant.

