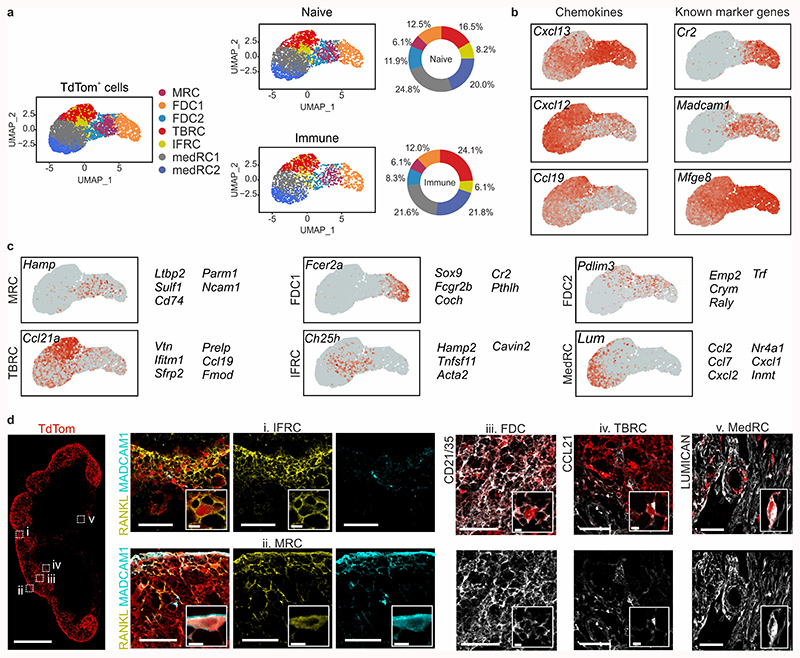
Figure 2. Single-cell transcriptomics analysis of lymph node BRC.
a, UMAP of TdTom-expressing lymph node reticular cells. The left-hand panel shows merged data from naive and immunized mice; condition-specific UMAP plots are depicted in the middle panel, and the relative subset abundances are depicted in the right-hand panel. b, Feature plots depicting the gene expression of chemokines and known FDC and MRC markers. c, Feature plots and top subset-specific marker genes for the indicated BRC clusters. d, Confocal microscopy analysis of the positioning and phenotype of BRC subsets in naïve Cxcl13-Cre/TdTom mice. Tissues were stained with the indicated subset-defining markers based on scRNA-seq analysis. Scale bars, 500 μm and 50 μm. Images are representative of at least three mice per marker. (a-c) ScRNA-seq data represents 5418 Cxcl13-Cre+ cells, N = 3 biological replicates, 2 independent experiments for naive BRC, N = 4 biological replicates, 3 independent experiments for BRC from immunized mice.

