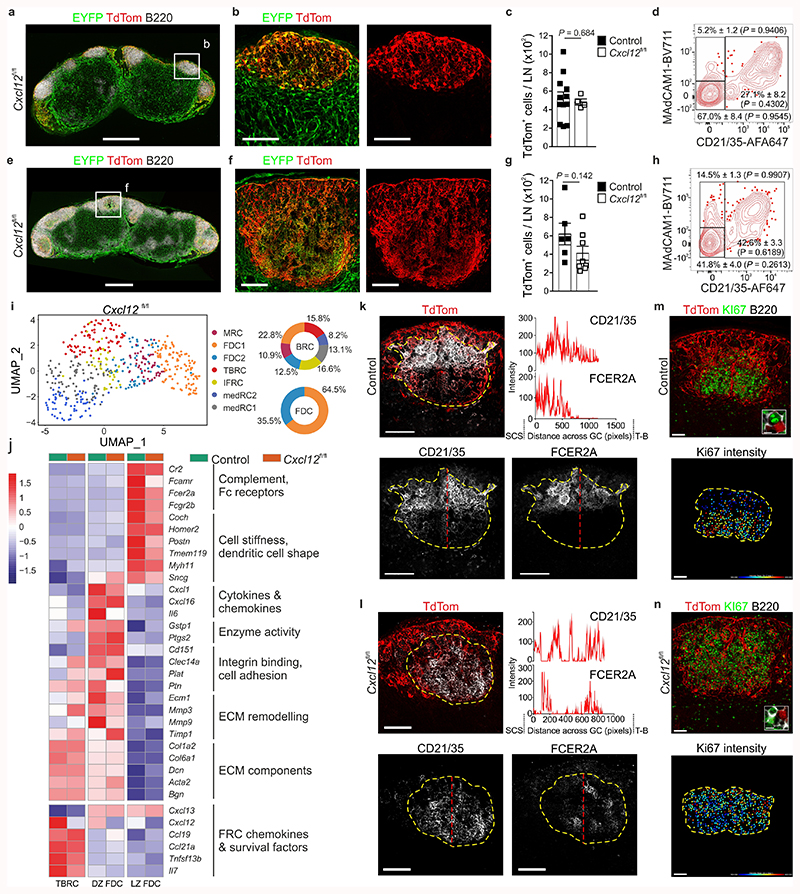
Figure 4. Transcriptional and topological changes in Cxcl13-Cre/TdTom Cxcl12 fl/fl lymph nodes.
a,b, Representative lymph node (a) and B cell follicle (b) overview in naive Cxcl13-Cre/TdTom EYFP Cxcl12 fl/fl mice (Cxcl12 fl/fl). Scale bars, 500 μm (a), 100 μm (b). N = 4. c, TdTom+ cell enumeration in naive Cxcl13-Cre/TdTom EYFP control or Cxcl12 fl/fl mice. N = 12 control Cxcl13-Cre/TdTom EYFP mice and 4 Cxcl12 fl/fl mice, 2 independent experiments. d, Representative flow cytometry plot of MAdCAM1 and CD21/35 expression by TdTom+ cells from naive Cxcl12 fl/fl mice. N = 12 Cxcl12 fl/fl mice, 3 independent experiments. e,f, Representative lymph node (e) and B cell follicle (f) overview from VSV-immunized Cxcl12 fl/fl mice. Scale bars, 500 μm (e), 100 μm (f). N = 8 mice, 3 independent experiments. g, TdTom+ cell enumeration in immunized control or Cxcl12 fl/fl mice. N = 6 control, 8 Cxcl12 fl/fl mice, 2 independent experiments. h, Representative flow cytometry plot of MAdCAM1 and CD21/35 expressing BRCs from immunized Cxcl12 fl/fl mice. N = 9 Cxcl12 fl/fl mice, 2 independent experiments. i, UMAP plot and relative BRC subset abundance of TdTom+ cells from immunized Cxcl12 fl/fl mice. j, Scaled gene expression of FDC marker and curated genes in immunized control and Cxcl12 fl/fl mice. k,l, Representative images of CD21/35 and FCER2A in control and Cxcl12 fl/fl mice. Dotted yellow lines indicate the GC perimeter and dotted red lines indicate the axis of CD21/35 and FCER2A intensity measurement. Scale bars, 100 μm. m,n, Representative images of Ki67+ B220+ cells in control or Cxcl12 fl/fl mice. Scale bars, 50 μm. (c,g) Mean percentages and SEM are indicated; P values as per two-tailed Mann Whitney Test. (d,h) Mean percentages and SEM are indicated; P values as per one-way ANOVA with Tukey’s multiple comparisons test. (i,j) scRNA-Seq represents 487 Cxcl12 fl/fl BRC; 3 independent experiments. (k-n) Images are representative of 5 mice per group.

