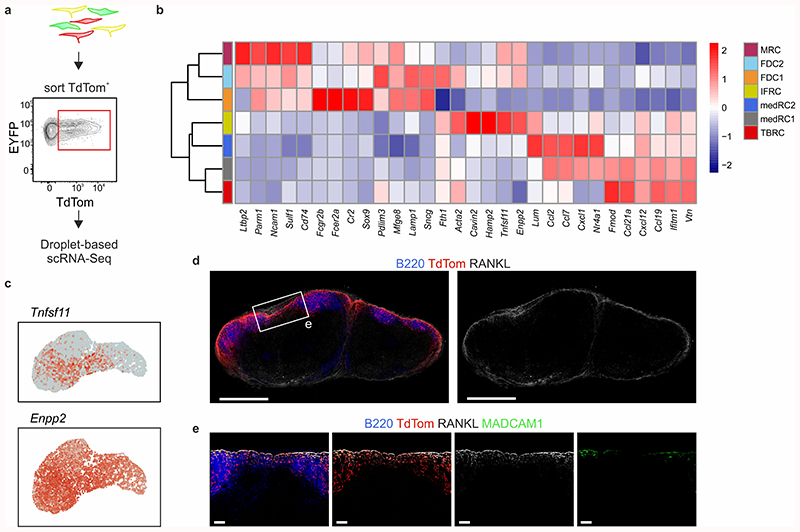
Extended Data Fig. 2. Single cell transcriptomic analysis of B cell-interacting reticular cells.
a, Schematic representation of the experimental setup. b, Heatmap of the averaged gene expression of top cluster-specific genes across all BRC subsets. Hierarchical grouping based on cluster-specific marker genes is depicted in the left panel. c, Feature plots depicting the expression of the indicated genes. d, Representative overview of RANKL staining in naïve Cxcl13-Cre/TdTom mouse lymph nodes. e, The indicated interfollicular region from (d) stained for B220, RANKL and MAdCAM1. Images are representative of at least three mice.

