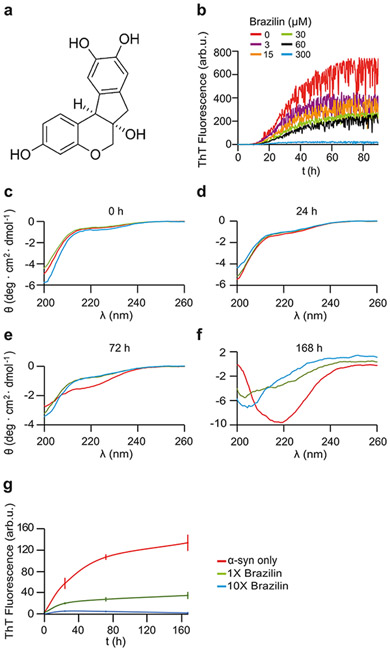
Figure 1:
a) Structure of Brazilin molecule. b) Buffer subtracted ThT kinetic aggregation data of α-syn and Brazilin. Graphs represent averages of triplicate curves with Brazilin concentrations from 0 - 300 μM as indicated by the color coding of graphs. c-f) Circular dichroism (CD) spectra of 50 μM α-syn in ThT buffer with 0x (red), 1x (green), 10x (blue) molar ratio Brazilin at 0 h (c), 24 h (d), 72 h (e), and 168 h (f). g) ThT kinetics of CD samples after 2 minutes of sonication; means ± SD, n = 3.

