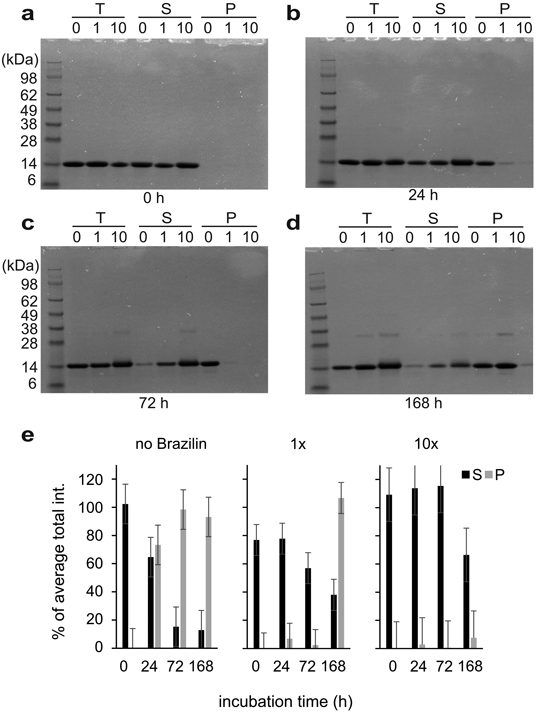
Figure 3:

SDS PAGE gel electrophoresis of α-syn incubated with various concentrations of Brazilin (0x, 1x, and 10x) at 0 h (a), 24 h (b), 72 h (c), and 168 h (d). The T represents total, S represents supernatant taken after ultracentrifugation at 100,000 xg at 4°C for 30 minutes, and P represents the pellet after ultracentrifugation after a wash with 1x PBS resuspended in an equal buffer volume. e) Densitometric quantification of SDS-PAGE bands from supernatant (S) and pellet (P) fractions. Total (T) fractions from untreated α-syn samples from each gel were set as 100% and mean densities and SD were calculated from these data (n = 4).
