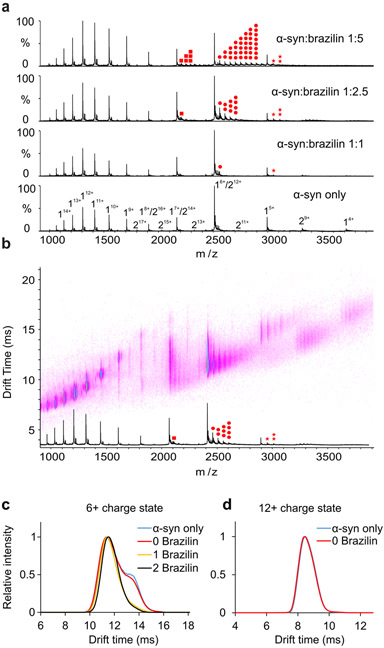
Figure 4:
a) Positive-ion ESI mass spectra of α-syn in the absence (DMSO) or in the presence of 20 μM, 50 μM or 100 μM Brazilin in 50 mM ammonium acetate buffer. Brazilin binds to the 5+, 6+ and 7+ charge states of α-syn monomer. The monomer of α-syn is designated by “1”, the dimer by “2”. Brazilin copies are highlighted in red dots (7+: square, 6+: circle, 5+: star; the number of dots represents the number of ligands bound). b) Native ESI-IM-MS driftscope plot of different charge states of α-syn in the presence of 50 μM Brazilin (molar ratio of protein and small molecule is 1:2.5). The ESI-IM-MS driftscope shows IMS drift time versus m/z, and the corresponding ESI mass spectrum is shown at the bottom. Brazilin copies are highlighted in red dots as shown in Figure 4a. c) Arrival time distributions of the 6+ charge state of monomeric α-syn and its different Brazilin adducts as indicated in the inset (number of small molecules bound) obtained in the absence or presence of 50 μM Brazilin (α-syn: Brazilin molar ratio of 1:2.5. Blue line: monomer only; red line: monomer remaining ligand-free in the presence of Brazilin; yellow line: 1 Brazilin bound; black line: 2 Brazilin bound). Two distinct conformations of α-syn were observed for the unbound 6+ monomeric α-syn; while only one conformation was observed for the small molecule-bound ions. d) Arrival time distributions of the 12+ charge state of monomeric α-syn in the absence or presence of 50 μM Brazilin (α-syn:Brazilin molar ratio of 1:2.5. Blue line: monomer only; red line: monomer remaining ligand free in the presence of Brazilin).

