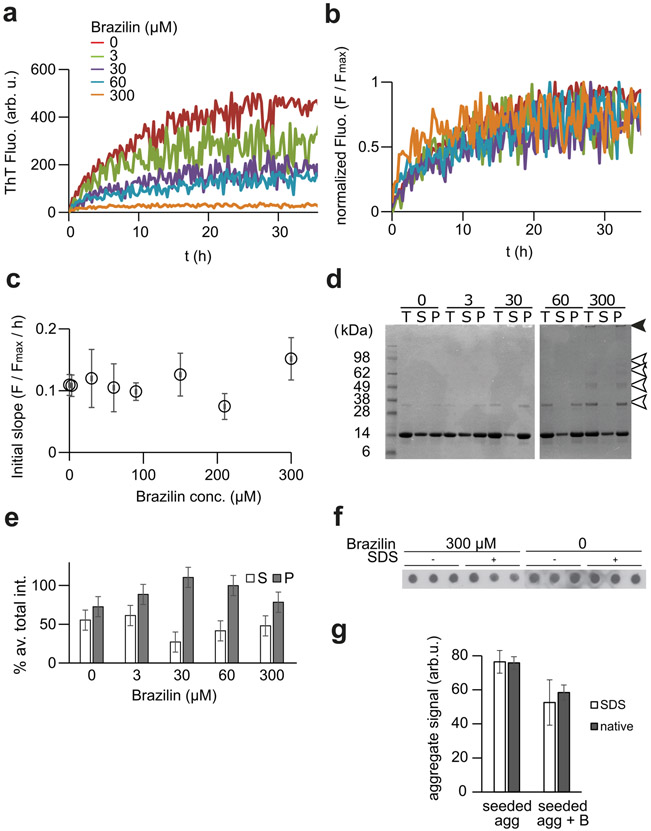
Figure 5:
a) Buffer subtracted ThT kinetic aggregation data of α-syn (30μM) in ThT buffer with various concentrations of Brazilin in the presence of 5% fibrillar seed. Seeds were generated by sonication of mature fibrils for 10 minutes. b) ThT aggregation data from (a) normalized to plateau signals. c) Average initial slopes of the normalized ThT kinetic data were calculated by linear regression the first two hours of fluorescent readings. The graph represents means ± SD from two independent experiments each performed in triplicate. d) SDS-PAGE of seeded α-syn aggregation in the presence of various Brazilin concentrations. The T represents total, S represents a fraction of the supernatant taken after ultracentrifugation of the total at 100,000 xg at 4°C for 30 minutes, and P represents the pellet left after ultracentrifugation dissolved in 1:1 NaP:Loading buffer after a wash with 1x PBS. Arrows indicate SDS-resistant HMW aggregates (black) and di- and oligomers (white) f) e) Densitometric quantification of SDS-PAGE bands from supernatant (S) and pellet (P) fractions. Total (T) fractions were set as 100% and mean densities and SD were calculated from these data (n = 4). f, g) Quantification of aggregates in a filter retardation assay. α-Syn (30μM) were incubated for 72 h without or with 300 μM Brazilin in the presence of 5% seed as in (a). Samples were either boiled in 2% SDS for 5 min or not SDS-treated to quantify SDS-resistant and total aggregates were filtered through a cellulose acetate membrane, stained with anti-α-syn mAb 211 (1:2000) and quantified densitometrically. Bar graphs in g) represent mean ± SD, n = 3.

