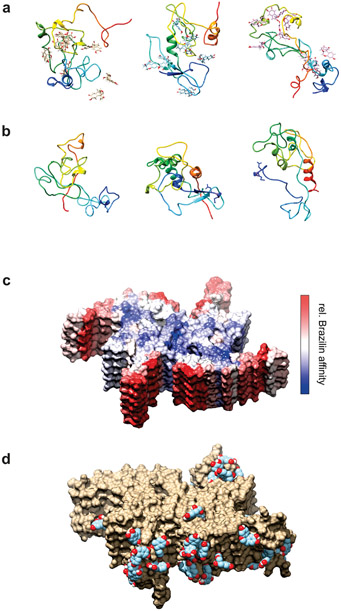
Figure 9:
a), b) Simulated α-syn structures after 100 ns equilibration from three of the trajectories with Brazilin (a) and without (b). Each vertical pair started from the same initial structure. Protein chains are illustrated in rainbow coloring (N-term blue → C-term red). c), d) Simulated α-syn fibril fragment (PDB 6a6b) in the presence of ~100 mM Brazilin. (c) Structure colored according to the logarithm of the number of contacts between Brazilin and the protein. Red represents maximum contacts (highest affinity) through white to blue representing minimum contacts (lowest affinity). The upper blue face (and the lower blue face, not visible) are the directions in which addition of new monomers would extend the fiber. (d) Examples of Brazilin molecules bound to highest affinity areas of the fibril model.

