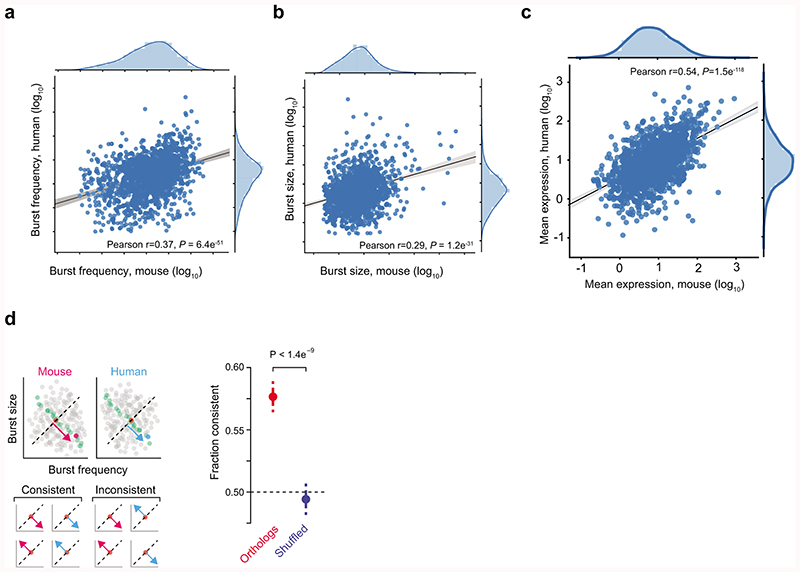
Extended Data Figure 9. Conservation of transcriptional kinetics in mouse and human.
(a) Scatter plot of burst frequency between one-to-one orthologs of mouse and human (n = 1,609 genes). (b) Scatter plot of burst size between one-to-one orthologs of mouse and human (n = 1,609 genes). (c) Scatter plot of mean expression between one-to-one orthologs of mouse and human (n = 1,609 genes). (d) Left: Illustrating the test for conservation beyond mean expression level. In both mouse and human, the ortholog is compared to 50 genes of similar mean expression (7 genes in cartoon) and we determine whether the location on the diagonal is consistent relative to the median gene in both species. Right: The fraction of one-to-one orthologs genes (red) and shuffled orthologs (blue) with consistent positioning in transcriptional kinetics space (binomial test, based on 1,609 genes). The error bars denote standard deviations. The limited numbers of cells and the use of RPKM-based transcriptional burst kinetics inference could underestimate the degree of conservation in transcriptional burst kinetics.

