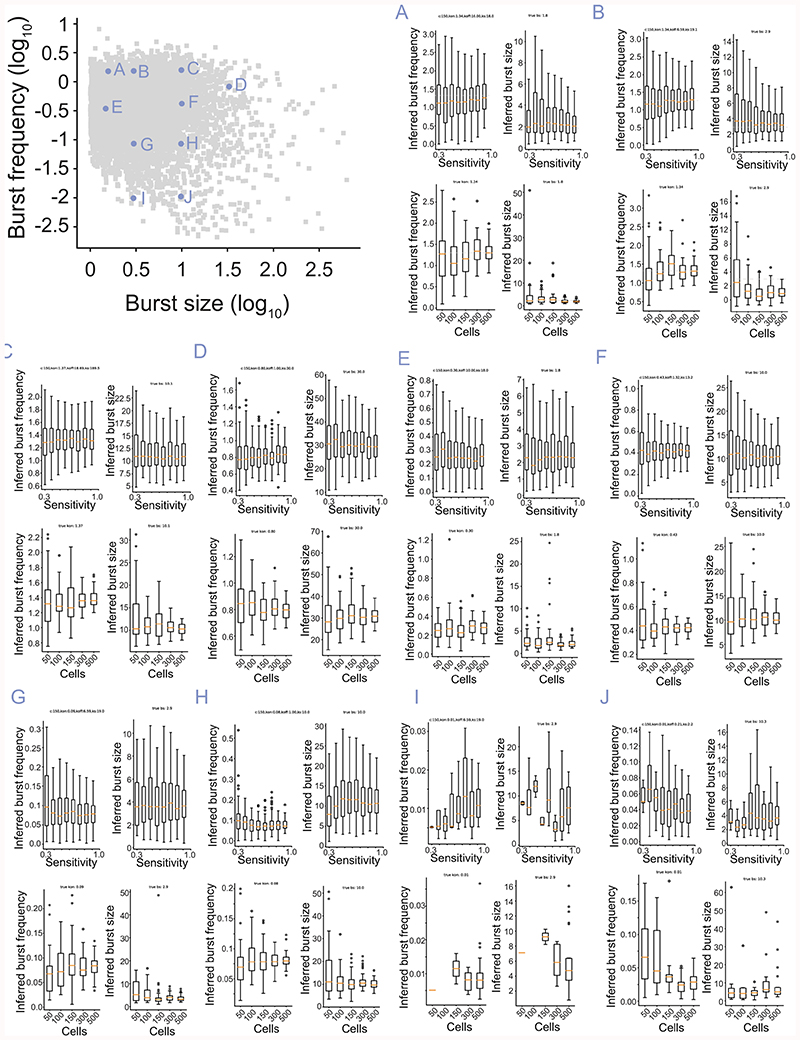
Extended Data Figure 2. Robustness of inference to cell numbers and technical noise in single-cell RNA-seq.
The distribution of inferred burst frequency and sizes as a function of sensitivity (loss of RNA molecules) and cell numbers, based on the location of the parameters in the kinetics parameter space (A-J). Center: Median, Hinges: 1st and 3rd quartiles, Whiskers: 1.5 interquartile range (IQR). Based on 50 simulations for each unique combination of parameters and 100 cells for the sensitivity calculations. Inferred burst sizes were divided by the sensitivity used in simulation (as the inferred burst size scales linearly with sensitivity).

