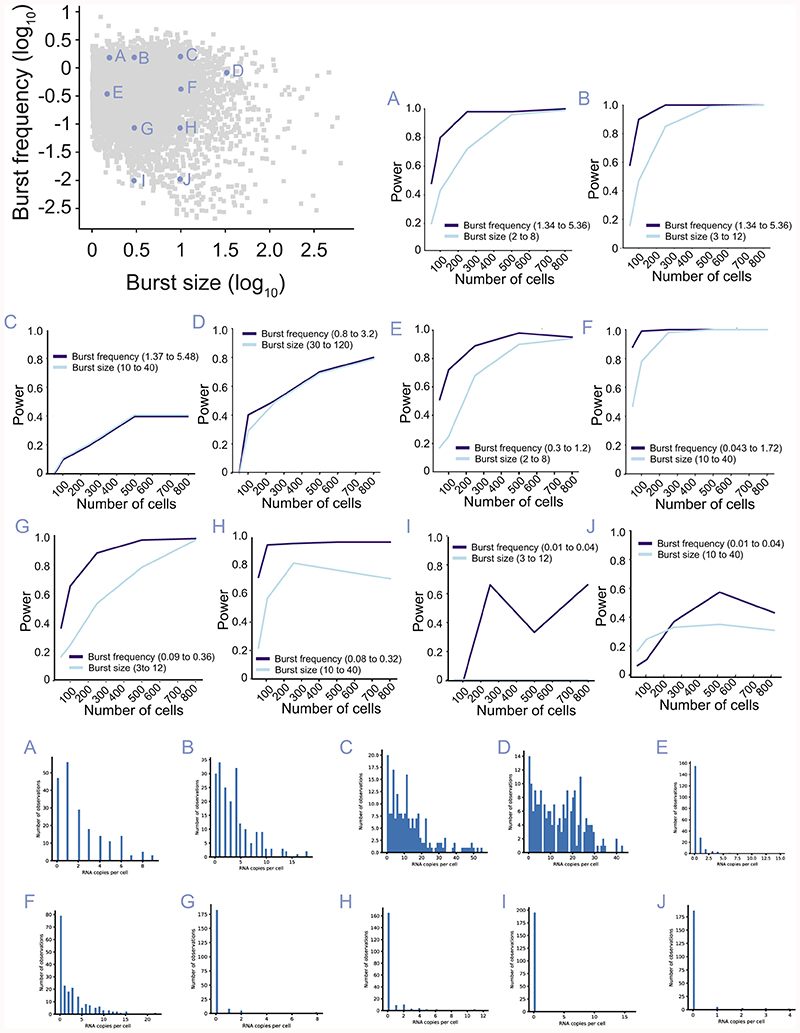
Extended Data Figure 4. Power analysis in different locations of kinetic parameter space.
The power of detecting 4-fold changes in burst frequency and size as a function of the number of cells depending on the location of transcriptional burst kinetic parameters in parameter space (A-J). Upper panels: Analysis of power for burst frequency and size in indicated location in parameter space. Lower panels: Histogram with expression distributions over cells at the different locations in parameter space.

