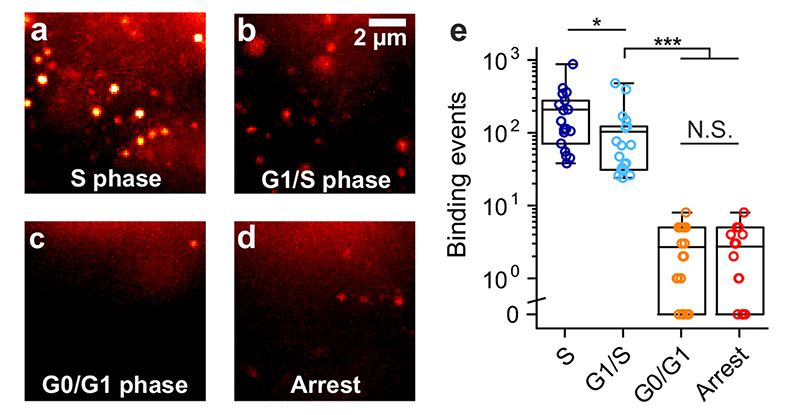
Figure 4. The observation of G4s in live cells is altered by the cell cycle phase and transcription.
Representative single-molecule images of G4-binding events are shown for synchronized U2OS cells in (a) the S phase, (b) the G1/S phase, (c) the G0/G1 phase and (d) for unsynchronized cells treated with both the transcriptional inhibitor DRB and the replication inhibitor Aphidicolin. Experiments a-d were repeated 3 times independently with similar results. (e) Quantification of binding events lasting more than two frames (100 ms per frame) per cell in living U2OS cells at different cell-cycle phases and after transcription/replication arrest. Center lines indicate the median; boxes show interquartile range; whiskers denote 5th and 95th percentiles. *** P < 10-6, * P = 0.01, N.S P = 0.99, two-sided Mann-Whitney U test. n = 18, 19, 19 and 15 cells for S, G0, G1 and Arrest respectively, taken from 3 independent replicates.

