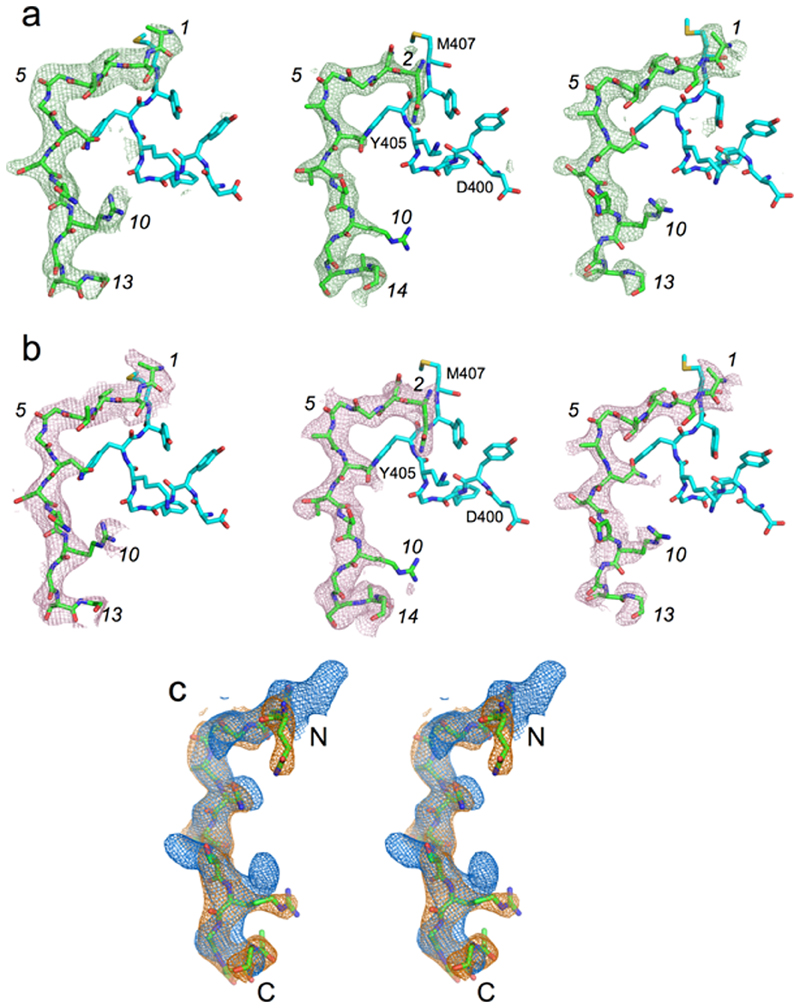
Extended Data Fig. 8. Electron density comparison for different peptide ensembles.
a, Fo-Fc electron density maps (contoured at 3.0 σ) for the modelled peptide following final refinement for RagAB purified from W83 KRAB (left panel; 3.4 Å resolution), RagAB from W83 wild type co-crystallised with excess P21 peptide (middle panel; 2.6 Å), and RagAB from W83 wild type (right panel; 3.0 Å). Peptide sequence of the P21 co-crystal structure is arbitrarily modelled as QNGGANTSRGSAG, with numbering in italics according to the W83 KRAB peptide. Neighbouring residues D400-M407 of RagA are shown as cyan stick models for orientation purposes. b, Simulated annealing composite 2Fo-Fc omit maps for peptides bound to RagAB complexes as in (a). An annealing temperature of 500 K was used, with 5% of the models omitted. The fact that two different peptide ensembles produce similar maps as the P21 peptide, together with the inability to model the P21 sequence, suggests that the substrates are bound with register shifts and perhaps different chain directions. c, Stereo view of superposed 2Fo-Fc maps (made within Phenix; 1.0 σ, carve = 2.0) for WT RagAB in the absence (blue) and presence (orange) of P21 peptide, generated with the same high resolution cutoff (3.0 Å). For orientation purposes, the P21 peptide model is shown as sticks.

