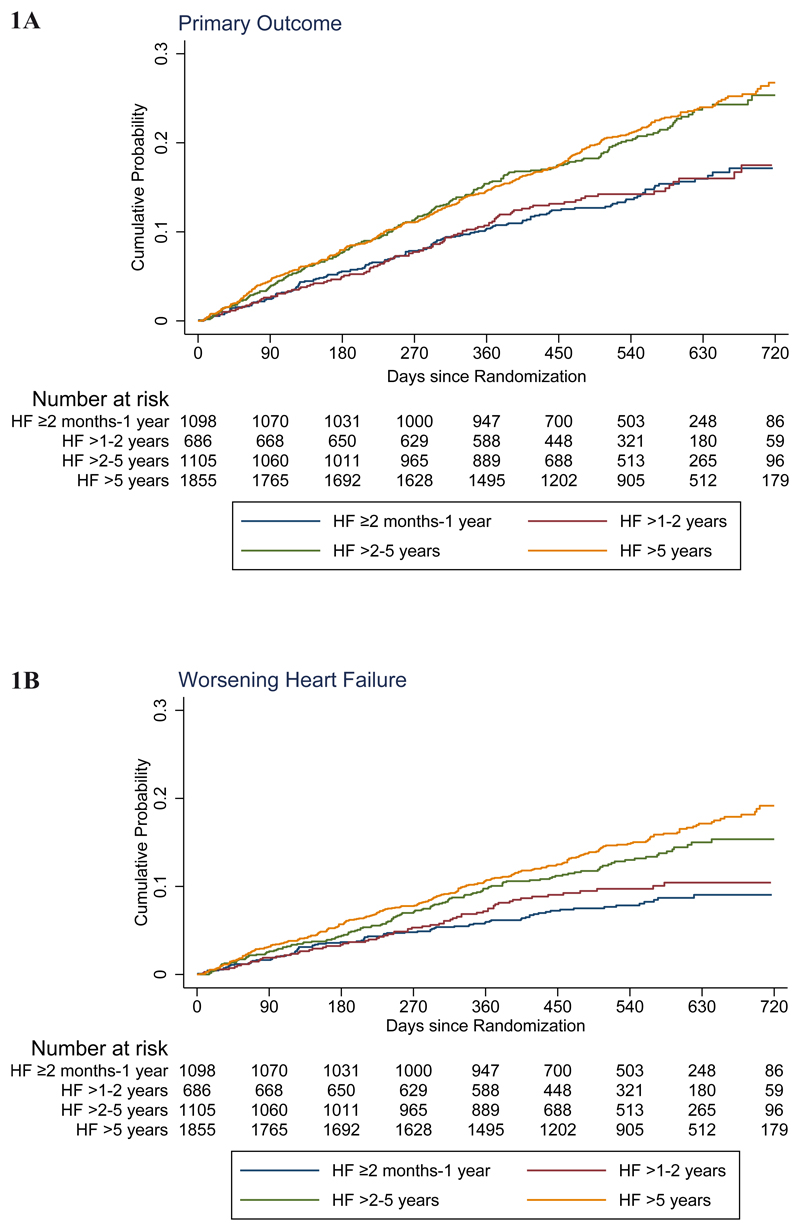
Figure 1. Kaplan-Meier curves for key study outcomes, according to heart failure duration.
The primary outcome was the composite of time to first worsening heart failure event or death from cardiovascular causes. The panels in this figure show cumulative event curves for: (A) Primary composite outcome (worsening heart failure or death from cardiovascular causes), (B) worsening heart failure, (C) death from cardiovascular causes, and (D) death from any cause.

