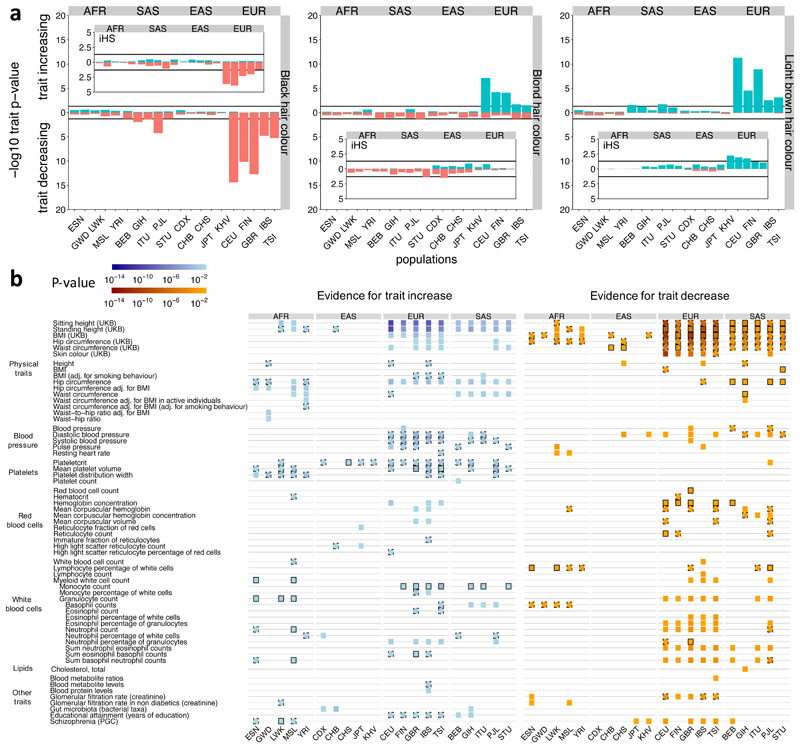
Figure 6. Evidence of selection on traits.
a, P-values for evidence of directional selection of black, blond, and light brown hair color (see Methods for calculation of p-values). Insets show p-values for the same test but using iHS scores instead, where iHS scores are calculated for each population separately for any variant with a minor allele frequency >5% in that population. b, Evidence for directional or bidirectional selection on multi- allelic traits. Each trait is associated with at least 10 SNPs in both effect directions in each of the considered populations. We show evidence for a trait increasing over time (left) and evidence for a trait decreasing over time (right) if p ≤ 0.05. Black boundaries indicate consistency with an additional test that tests for shifts in the DAFs (solid: p ≤ 0.05, dashed: p ≤ 0.5, Methods).

