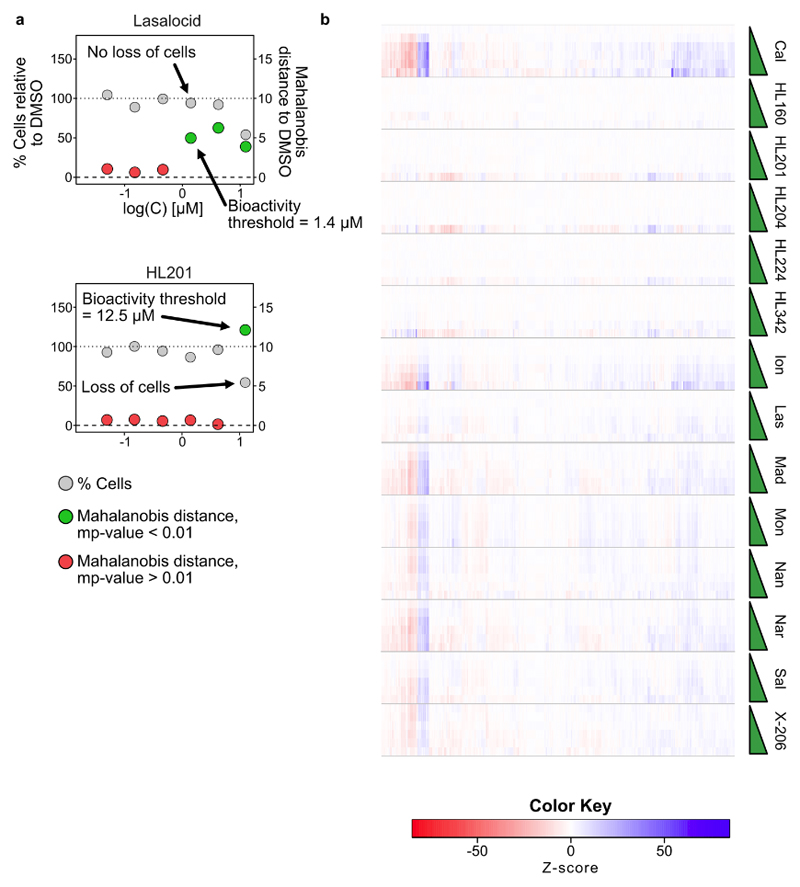
Extended Data Fig. 4. Use of morphological profiling via cell painting to determine bioactivity threshold in U-2OS cells.
a) Plots of cell count (grey) and Mahalanobis distance (‘Bioactivity’; red and green) against concentration of compound. Green points indicate significant activity (mp-value < 0.01) while red points indicate no significant activity (mp-value > 0.01). Many ionophores induce an active profile without loss of cell viability while bioactivity of the hybrid ionophores is correlated with a loss of cells, indicating a profile representing toxicity. The bioactivity threshold is determined as the first concentration to reach significance (mp-value < 0.01) b) Dose-dependent morphological profiles from which the bioactivity threshold is determined. Note that some ionophores change profile at higher concentrations, e.g. calcimycin (Cal) and nan-changmycin (Nan), typically correlated with a loss of cells. See Supplementary Fig. 3–9 for representative images, all dose-response plots, profiles and correlation matrices in both U-2OS and Vero cells.

