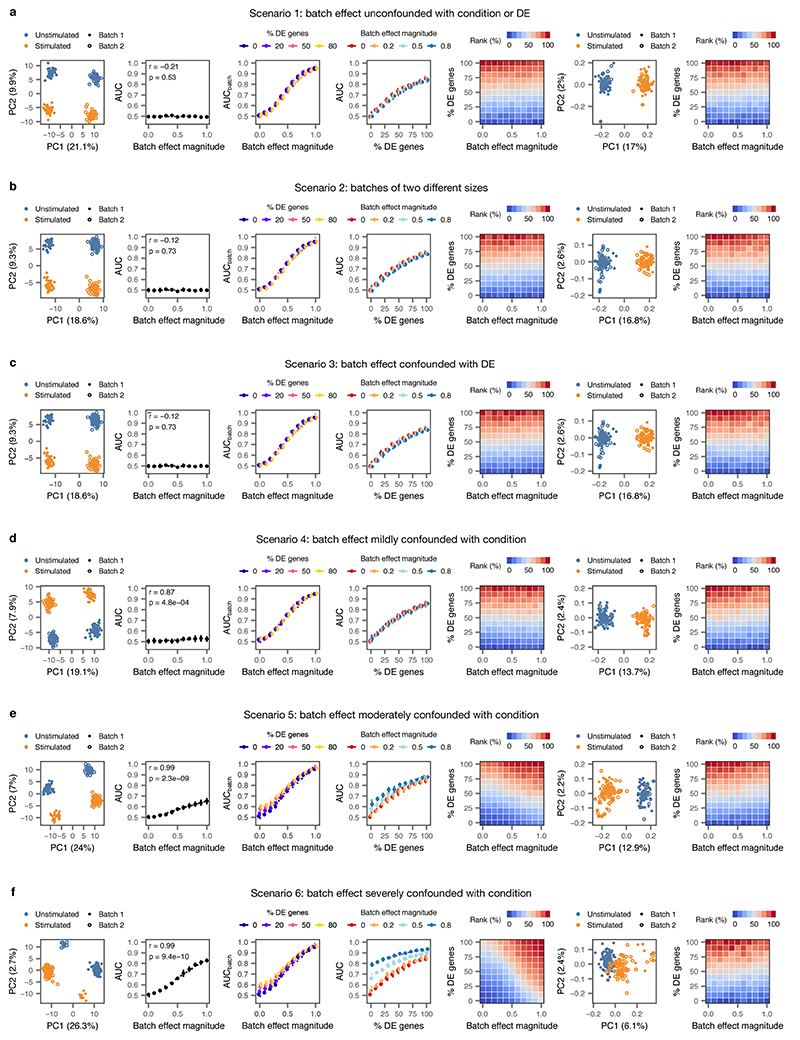
Extended Data Fig. 10. Impact of batch effects on cell type prioritization.
Two populations of cells (n = 200 cells total) were simulated, with each condition sequenced in two batches, and varying degrees of perturbation-dependent differential expression and/or technical batch effects were introduced according to five different batch effect scenarios. For each of the five scenarios, the following panels are shown from left to right:
i, Principal component analysis (PCA) of a representative simulation.
ii, Correlation between AUC and magnitude of simulated batch effect with 0% of genes differentially expressed in response to perturbation, reflecting the introduction of a spurious difference between conditions where none exists (inset, two-sided Pearson correlation).
iii, Correlation between AUC and magnitude of simulated batch effect when the random forest classifier is tasked with predicting batch rather than condition (AUCbatch), confirming the batch effect introduces the expected separability.
iv, Correlation between proportion of genes differentially expressed in response to perturbation and AUC for simulated populations of cells with no batch effect, and batch effects of three different magnitudes.
v, Cell type prioritizations in simulated populations of cells with varying perturbation intensity (% DE genes) and batch effect magnitudes.
vi, As in i, but after computational batch effect correction by alignment of mutual nearest neighbors16.
vii, As in v, but after computational batch effect correction by alignment of mutual nearest neighbors.
a, Impact of batch effects on cell type prioritization when technical batch is unconfounded with either condition or differential expression.
b, Impact of batch effects on cell type prioritization when batch #1 is twice as large as batch #2.
c, Impact of batch effects on cell type prioritization when perturbation-dependent differential expression is stronger in one of the two batches.
d, Impact of batch effects on cell type prioritization when technical batch is mildly confounded with condition (simulated cells are overrepresented in batch 1 by a factor of 20%).
e, Impact of batch effects on cell type prioritization when technical batch is moderately confounded with condition (simulated cells are overrepresented in batch 1 by a factor of 50%).
f, Impact of batch effects on cell type prioritization when technical batch is severely confounded with condition (simulated cells are overrepresented in batch 1 by a factor of 80%).

