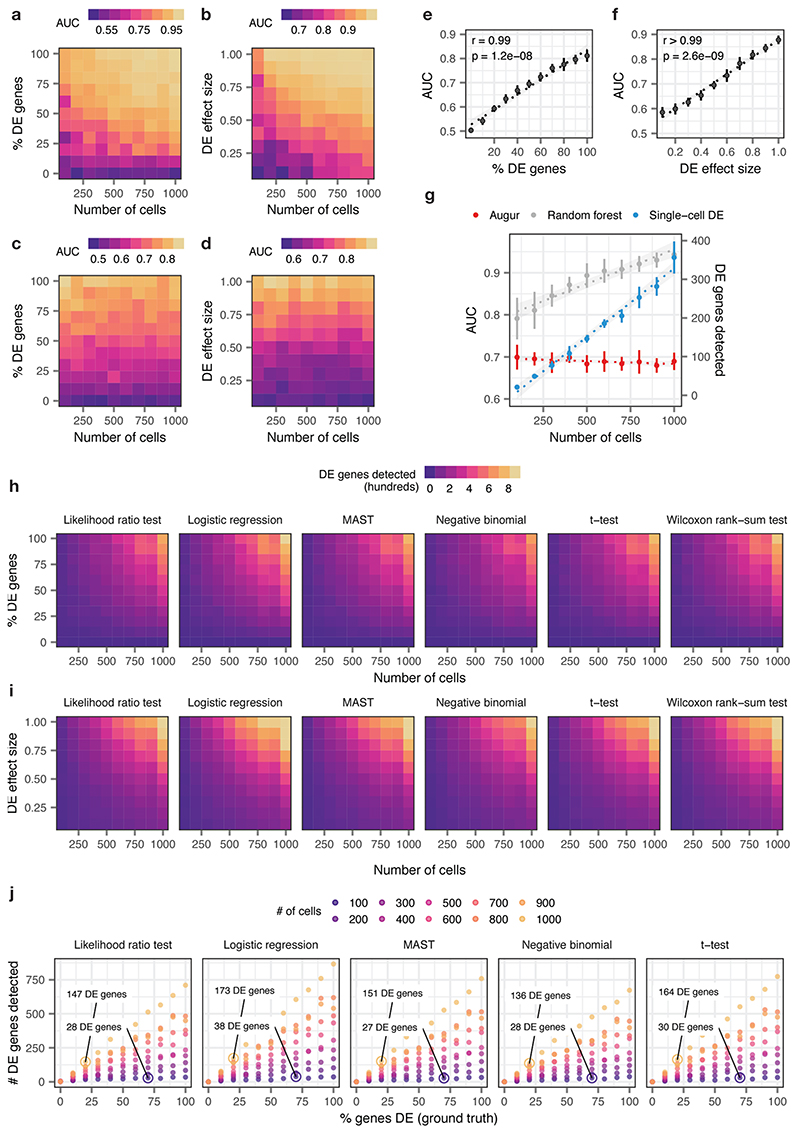
Extended Data Fig. 1. Augur overcomes confounding factors to cell type prioritization in simulated cell populations.
a-b, Area under the receiver operating characteristic curve (AUC) of a random forest classifier trained in three-fold cross-validation to distinguish two simulated populations of cells1, with the total number of cells increasing from n = 100 to n = 1,000 and the proportion of differentially expressed genes between the two populations varying from 0% to 100%, a, or the location parameter of the differential expression factor log-normal distribution varying from 0.1 to 1.0, b.
c-d, As in a-b, but with the naive random forest classifier replaced with the subsampling procedure employed by Augur.
e-f, Relationship between Augur AUC and the proportion of differentially expressed genes, e, or the location parameter of the differential expression factor log-normal distribution, f, in distinguishing two simulated populations (n = 200 cells total). The mean and standard deviation of n = 10 independent simulations are shown. Inset, two-sided Pearson correlation.
g, Cell type prioritizations (AUC or number of differentially expressed genes) for a naive random forest classifier, Augur, and an exemplary single-cell differential expression test2, the Wilcoxon rank-sum test, for two simulated populations of cells with 50% of genes differentially expressed and a log-normal location parameter of 0.5, with the total number of cells increasing from n = 100 to n = 1,000 cells. Like a naive random forest strategy, the number of differentially expressed genes detected by the Wilcoxon rank-sum test scales linearly with the number of cells. The mean and standard deviation of n = 10 independent simulations are shown. Dotted lines show linear regression; shaded areas show 95% confidence intervals.
h-i, Number of differentially expressed genes detected by six tests for single-cell differential gene expression between two simulated populations of cells, with the total number of cells increasing from 100 to 1,000 and the proportion of differentially expressed genes between the two populations varying from 0% to 100%, h, or the location parameter of the differential expression factor log-normal distribution varying from 0.1 to 1.0, i.
j, Relationship between number of differentially expressed genes detected by five tests for single-cell differential gene expression and the proportion of differentially expressed genes simulated between the two populations, for simulated populations of between 100 and 1,000 cells (see also Fig. 1e). All single-cell differential expression tests detect a larger number of differentially expressed genes in a large population of cells with modest transcriptional perturbation (20% of genes differentially expressed) than in a smaller population of cells with more profound perturbation (70% of genes differentially expressed).

