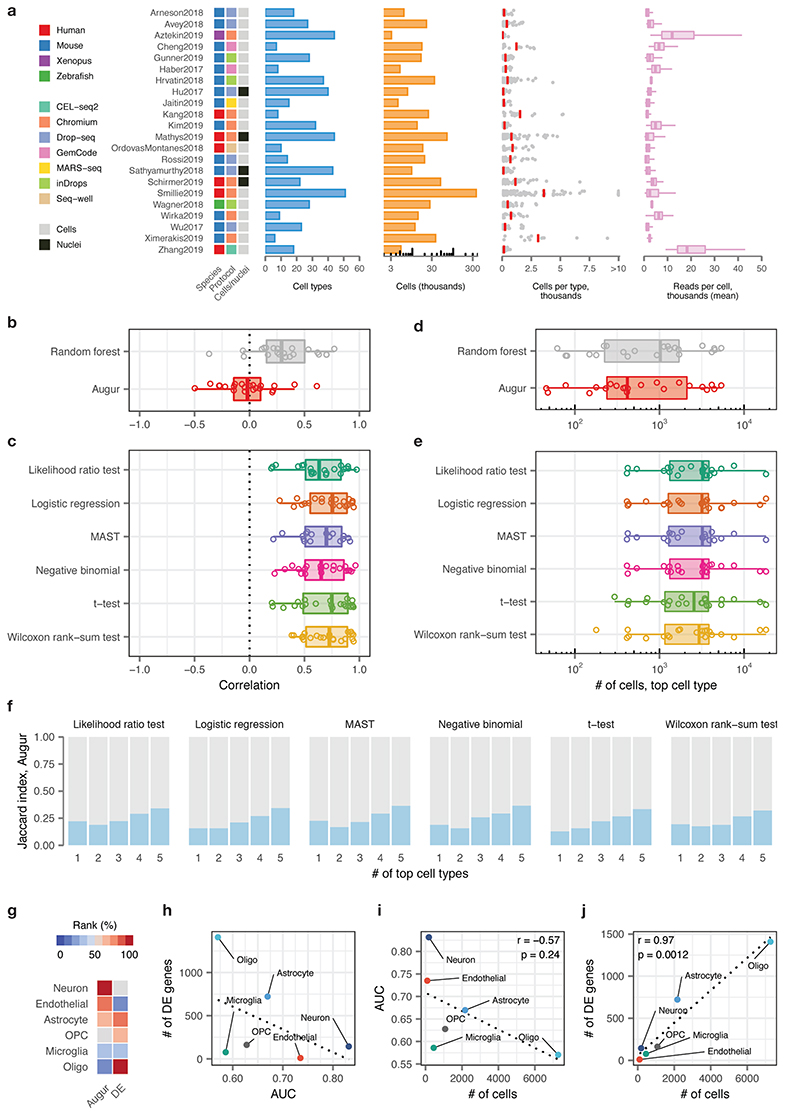
Extended Data Fig. 2. Augur overcomes confounding factors to cell type prioritization in a compendium of published single-cell RNA-seq datasets.
a, Overview of n = 22 published scRNA-seq datasets comparing two or more experimental conditions, used to verify the relationship between cell type prioritizations from a random forest classifier, Augur, or single-cell differential expression tests. Left, heatmap indicating the species of origin, the sequencing protocol, and whether cells or nuclei were sequenced. Right, properties of each dataset, including the total number of cell types identified in the original studies; the total number of cells sequenced; the number of cells per type (red bars indicate mean); and the mean number of reads for cells of each type.
b, Pearson correlations between the AUC of each cell type, and the number of cells of that type sequenced, across 22 datasets for Augur, bottom, and a naive random forest classifier without subsampling, top, as shown in Fig. 2c.
c, Pearson correlations between the number of differentially expressed genes per cell type, at 5% FDR, and the number of cells of that type sequenced, across 22 datasets for six statistical tests for single-cell differential expression.
d, Number of cells in the top-ranked cell type across 22 datasets for Augur, bottom, and a naive random forest classifier without subsampling, top.
e, Number of cells in the top-ranked cell type across 22 datasets for six statistical tests for single-cell differential expression.
f, Jaccard index between the top-ranked 1 to 5 cell types across 22 datasets, comparing Augur and six statistical tests for single-cell differential expression.
g, Cell type prioritizations in the Grubman et al., 20193 dataset by Augur and a representative test for single-cell differential expression, the Wilcoxon rank-sum test (“DE”).
h, Relationship between AUC and number of differentially expressed genes per cell type, at 5% FDR, in the Grubman et al., 2019 dataset. Dotted line shows linear regression.
i, Relationship between AUC and number of cells sequenced in the Grubman et al., 2019 dataset. Augur cell type prioritizations are uncorrelated with the number of cells per type. Dotted line shows linear regression; inset shows two-sided Pearson correlation.
j, Relationship between number of differentially expressed genes and number of cells sequenced in the Grubman et al., 2019 dataset. Cell type prioritizations based on the number of differentially expressed genes are strongly correlated with the number of cells per type. Dotted line shows linear regression; inset shows two-sided Pearson correlation.

