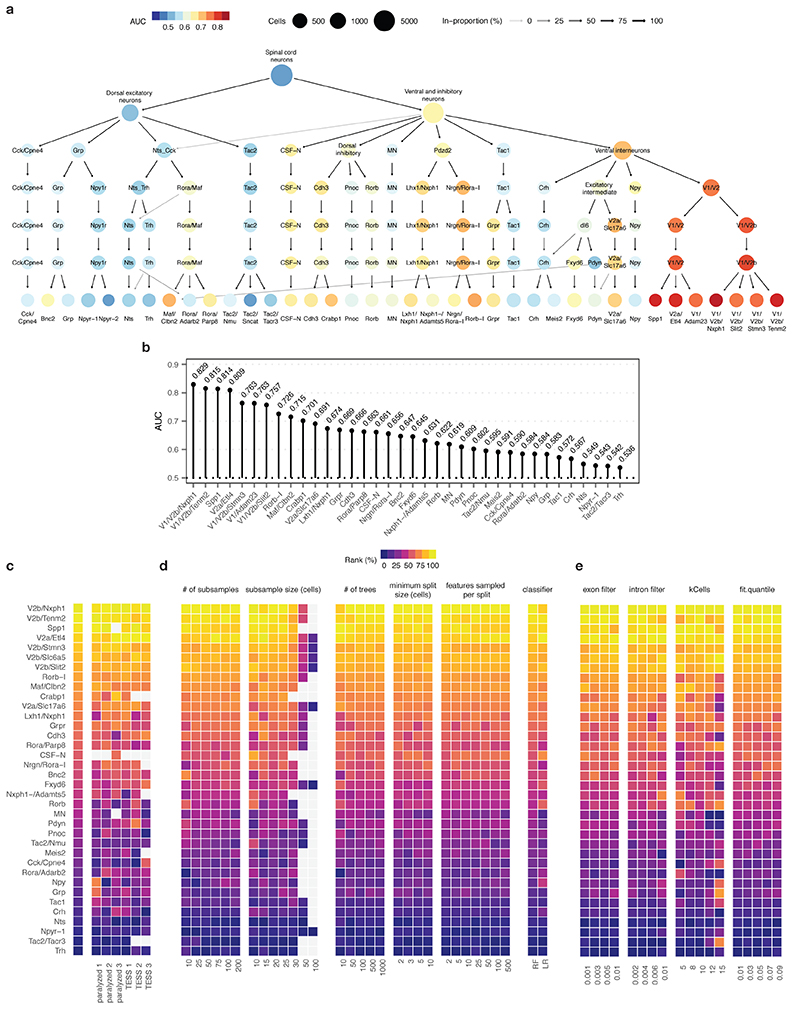
Extended Data Fig. 7. Robustness of Augur cell type prioritizations for mouse lumbar spinal cord neurons.
a, Clustering tree14 of mouse spinal cord neurons over seven clustering resolutions, revealing the hierarchical relationships between spinal cord neuron subtypes. Node color reflects AUCs for cell type prioritization in targeted electrical epidural stimulation.
b, AUCs for each of 37 neuron subtypes represented by at least 20 cells in both control and TESS-treated mice.
c-e, Robustness of cell type prioritization for neuron subtypes of the mouse lumbar spinal cord.
c, Impact of systematically withholding cells from each of six replicates (n = 3 per group) on cell type prioritization. Left, cell type prioritization with all six replicates, as in Fig. 2f. Grey tiles indicate neuron subtypes that were not represented by at least 20 cells in each condition after removal of cells from an experimental replicate.
d, Impact of varying Augur parameters, including the number of subsamples and the size of each subsample; random forest-specific hyperparameters (number of trees, minimum split size, number of features sampled per split); and the choice of classifier (random forest, RF; L1-penalized logistic regression, LR) on cell type prioritization. Grey tiles indicate sample sizes larger than the number of cells of that type in the dataset.
e, Impact of varying RNA velocity parameters, including exonic and intronic expression filters, the number of cells in the k-nearest neighbors pooling, and the extreme quantiles used to fit γ coefficients, on cell type prioritization.

