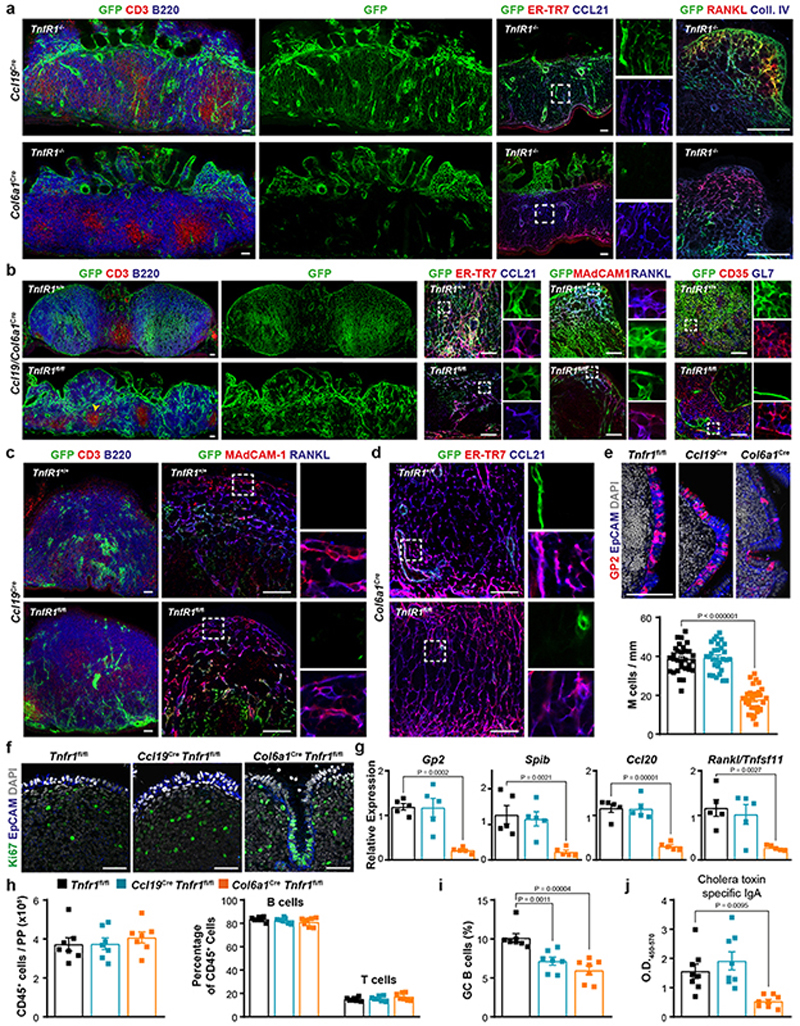
Extended Data Fig. 6. Peyer’s Patch structure of Tnfr1 –/– and Tnfr1 conditional knock out mice.
a, Confocal microscopy images display the topology of Ccl19Cre and Col6a1 Cre lineages in Tnfr1 –/– PPs (n=5 mice per group). b, Confocal microscopy analysis of adult PPs from Ccl19/Col6a1 Cre Tnfr1 fl/fl mice. The arrowhead shows the presence of T cell aggregates under an epithelial dome of Ccl19/Col6a1 Cre Tnfr1 fl/fl PPs. c, Images showing the B cell area (left) and the MRC network in Ccl19 Cre Tnfr1 +/+ and Tnfr1 fl/fl mice. d, Confocal images showing TRC networks in Col6a1 Cre Tnfr1 +/+ and Tnfr1 fl/fl mice. e-f, Confocal microscope analysis showing GP2+ M cells and Ki67+ proliferating cells in the epithelial dome of adult Tnfr1 fl/fl, Ccl19 Cre Tnfr1 fl/fl, Col6a1 Cre Tnfr1 fl/fl PPs. M cells were quantified in PP follicles from 5 mice per group. g, Relative expression of Gp2, Spib, Ccl20 and Tnfsf11 in whole PPs measured by real-time PCR (n=5 mice/genotype). h-i, Flow cytometric analyses characterizing the absolute numbers of CD45+ cells, and the proportion of B cells, T cells GC-B cells in PPs (n = 7 mice/genotype). j, ELISA of cholera toxin–specific IgA response. Mice were orally immunized with cholera toxin 1 week before the examination (n=8 mice/genotype). Scale bars, 50 μm. Images are representative of 5 mice per group, at least 3 independent experiments. P values as one-way ANOVA (e,g,h-j). Mean percentages and SEM are indicated.

