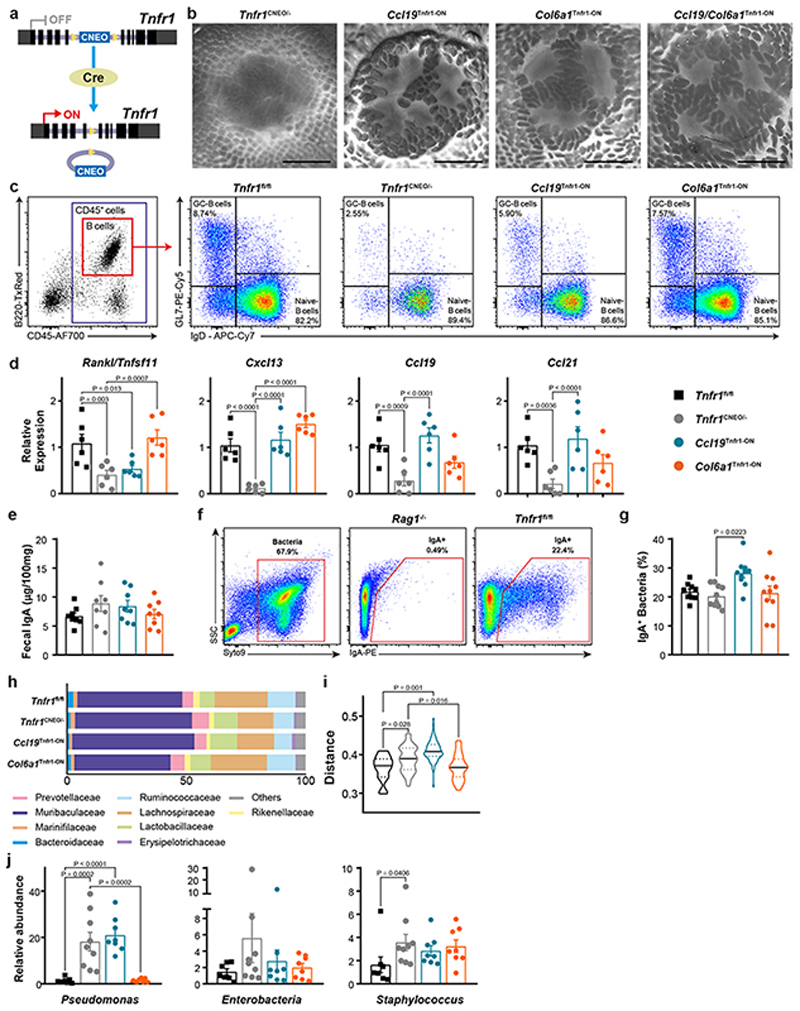
Extended Data Fig. 7. Structural and functional analysis of Tnfr1 reactivation in PP-FRCs.
a, Schematic description of Tnfr1 cneo model. b, PP stereoscope images from adult Tnfr1 cneo/-, Ccl19 Tnfr1-ON, Col6a1 Tnfr1-ON and Ccl19/Col6a1 Tnfr1-ON mice. Scale bar = 1mm. c, Gating strategy used in Figure 4d and 4i. d, Relative expression of Rankl/Tnfsf11, Cxcl13, Ccl19 and Ccl21 in FACS sorted PP-FRCs, measured by real-time PCR (n = 6 mice/genotype) e, Fecal IgA concentration measured by ELISA (n = 8 mice/genotype). f, Representative flow cytometry plots of IgA-coated bacteria. Rag1 –/– mice were used as a negative control. g, Frequencies of fecal IgA-coated bacteria in the indicated genotypes (n = 8 mice/genotype). h, Quantification of bacterial families with a relative abundance >1% in fecal samples. i, Unweighted UniFrac analysis for total fecal bacteria samples (Tnfr1 fl/fl n=8, Tnfr1 cneo/- n=9, Ccl19 Tnfr1-ON n=8 and Col6a1 Tnfr1-ON n=8). j, Relative abundance of Pseudomonas, Enterobacteria and Staphilococcus in fecal samples measured by qPCR (Tnfr1 fl/fl n=8, Tnfr1 cneo/- n=9, Ccl19 Tnfr1-ON n=8 and Col6a1 Tnfr1-ON n=8). P value as one-way ANOVA (d,e,g,j). Mean and SEM are indicated.

