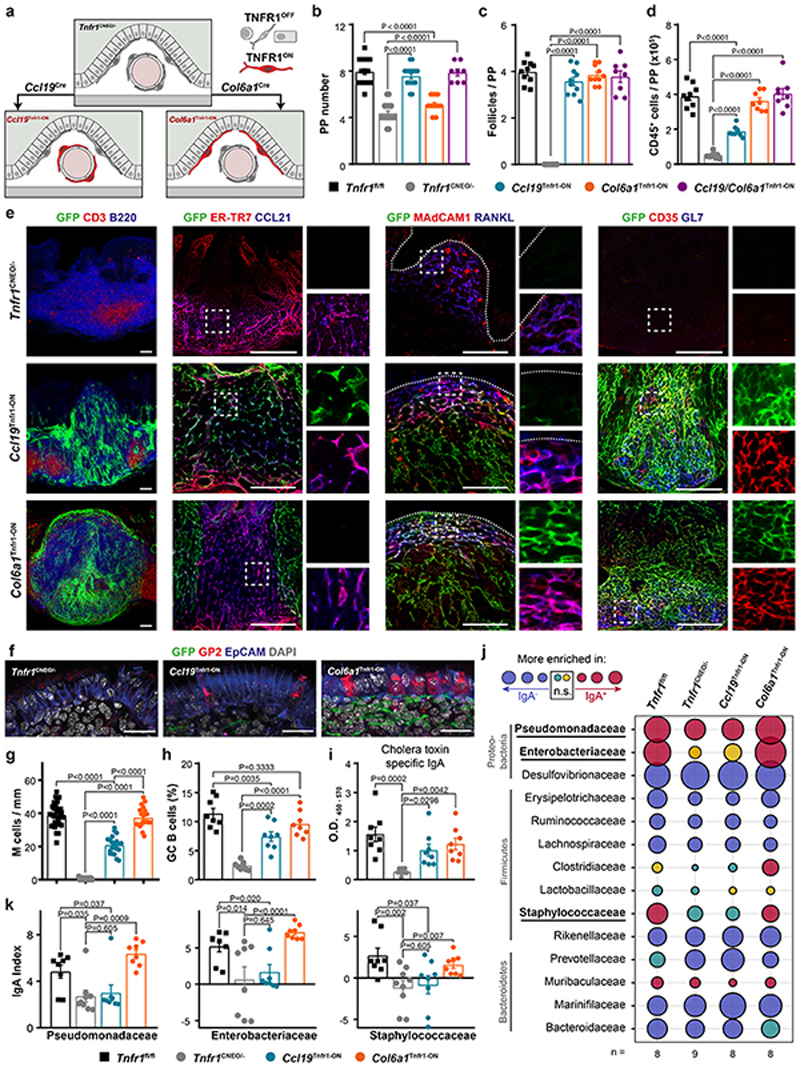
Figure 5. Tnfr1 expression by either of the two mesenchymal populations is sufficient to organize PPs.
a, Schematic of Tnfr1 cneo model. b-d, Quantification of the number of PPs, follicles per PP and CD45+ cells in adult Tnfr1 fl/fl, Tnfr1 cneo/-, Ccl19 Tnfr1-ON, Col6a1 Tnfr1-ON and Ccl19/Col6a1 Tnfr1-ON mice. e, Histological analysis of adult PPs from Tnfr1 cneo/-, Tnfr1C cl19-ON and Tnfr1 Col6a1-ON mice showing Cre-mediated GFP expression (green) and the indicated markers for B cells (B220), T cells (CD3), TRCs (ER-TR7 and CCL21), MRCs (MAdCAM-1 and RANKL), FDCs (CD35) and germinal center B cells (GL7). Box shows magnified areas. Dot lines mark the epithelial layer. Scale bar, 50μm. Representative of 5 mice per group. f-g, Confocal images and quantification of GP2+ M cells in the epithelial dome. Scale bar, 25 μm. Several PP follicles from Tnfr1 fl/fl (n=6), Tnfr1 cneo/- (n=4), Ccl19 Tnfr1-ON (n=5) and Col6a1 Tnfr1-ON (n=5) mice were analyzed. h, Flow cytometric analyses characterizing the proportion of GC-B cells in PPs (n=8 mice/genotype). i, ELISA of cholera toxin–specific IgA response. Mice were orally Ccl19/Col6a1 Tnfr1-ON mice. e, Histological analysis of adult PPs from Tnfr1 cneo immunized with cholera toxin 1 week before the examination (n=8 mice/genotype). j, Bubble plot showing IgA responses to major bacteria taxons, defined by the IgA index. Threshold for significant enrichment was determined by paired Wilcoxon test (P<0.05). k, IgA index in fecal bacterial samples of Pseudomonadaceas, Enterobacteriaceae and Staphylococcaceae from the indicated genotypes (Tnfr1 fl/fl n=8, Tnfr1 cneo/- n=9, Ccl19 Tnfr1-ON n=8, Col6a1 Tnfr1-ON n=8). P values as one-way ANOVA (b-d, g-i,k) or Wilconxon rank sum test (j). Mean and SEM are indicated.

