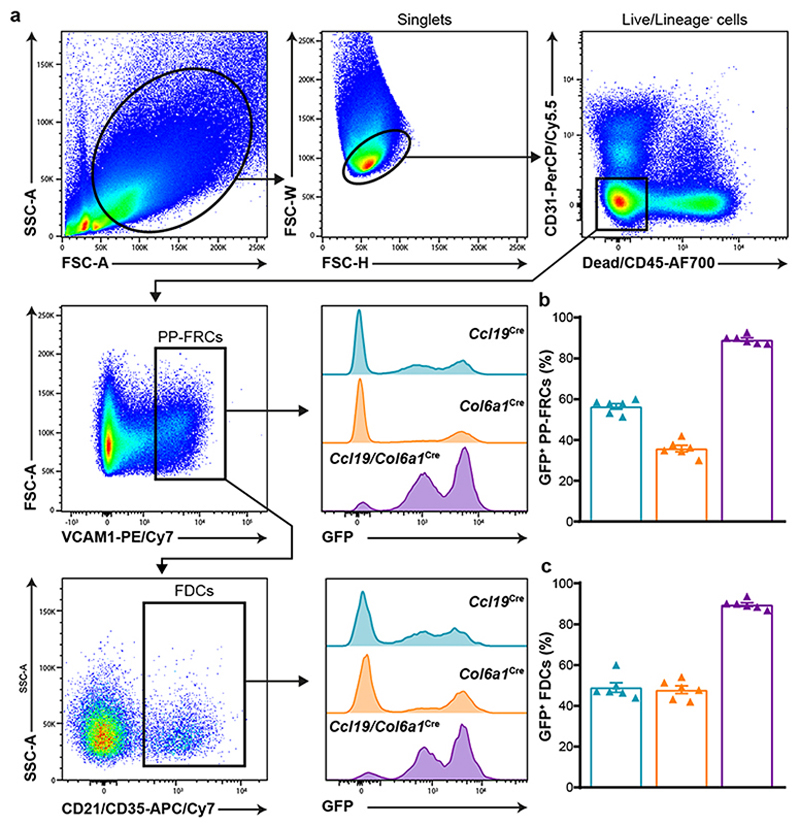
Extended Data Fig. 1. Flow cytometry analysis of PP-FRC and FDC targeting by the Ccl19Cre and Col6a1Cre strains.
a, FACS gating strategy used to analyze Cre-mediated GFP expression in PP-FRCs (live CD31-CD45-VCAM-1hi cells) and CD21/CD35+ FDCs from Ccl19 Cre R26 mTmG, Col6a1 Cre R26 mTmG and Ccl19/Col6a1 Cre R26 mTmG mice. b-c, Bar plot shows the proportion of targeted total FRCs (b) and FDCs (c) in these mice (n= 6 mice/genotype). Mean percentages and SD are indicated.

