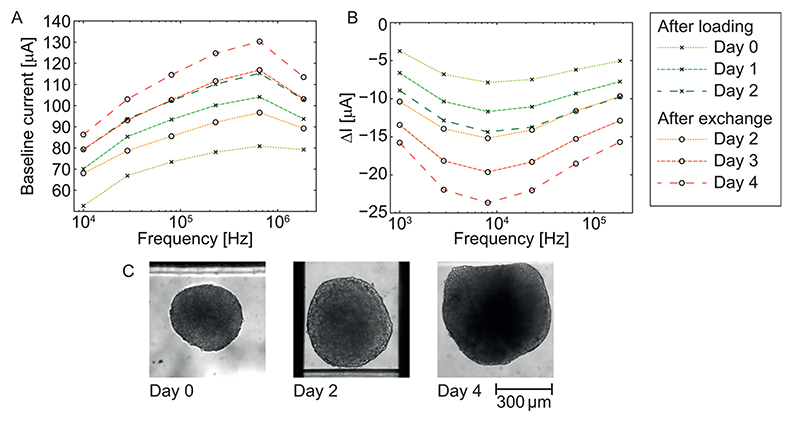
Figure 3. Current spectra of a cancer spheroid at selected time points.
(A) baseline current spectra; (B) ΔI peak-to-baseline spectra. Spectra are shown for selected time points between days 0 and 4; on day 2, the medium in all reservoirs was exchanged so that data before and after medium exchange on the same day are shown. (C) Optical monitoring of the growth of the very same spheroid measured by EIS in panel B.

