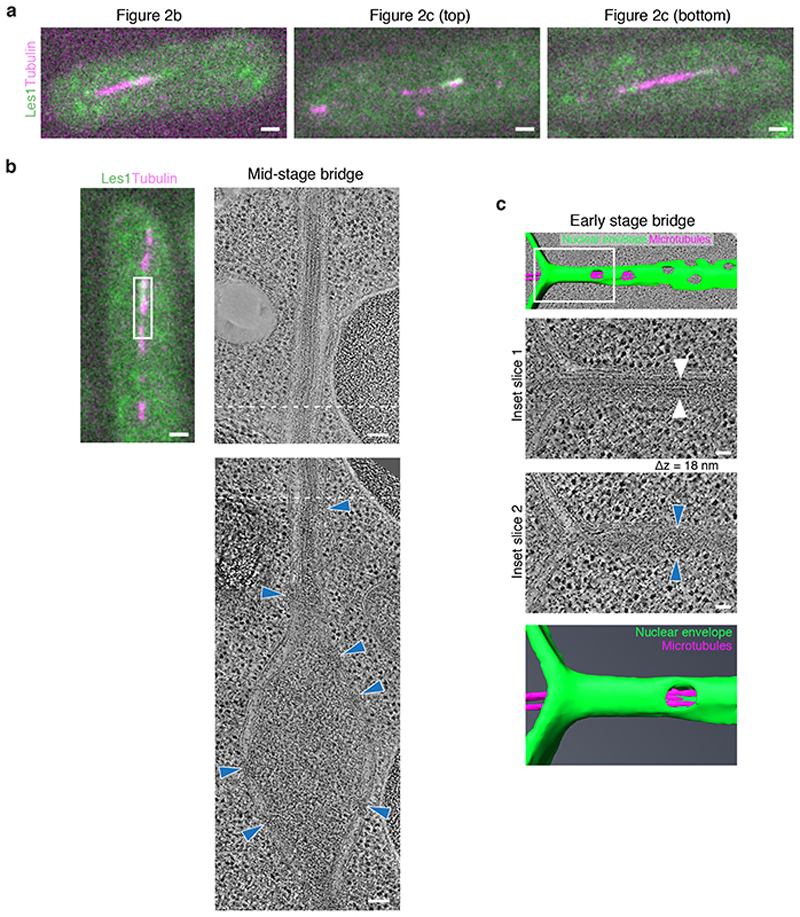
Extended Data Figure 3. Electron tomography of mid- and early-stage bridges with correlative fluorescence images.
a. Fluorescence images of resin sections through cells expressing Les1-mNeonGreen (green) and Atb2-mCherry (magenta), corresponding to cells that were imaged by electron tomography and are shown in Figure 2b (left image), Figure 2c top panel (middle image) and Figure 2c lower panel (right image). Images have been rotated to match approximately the orientation of electron tomograms. Scale bars = 1 μm. Representative of 1 (Figure 2b) and 5 technical repeats (Figure 2c), respectively. b. Fluorescence image of resin section through a cell expressing Les1-mNeonGreen (green) and Atb2-mCherry (magenta), corresponding to cell imaged by electron tomography shown to the right, indicated by white region. Scale bar = 1 μm. The right two panels are virtual slices through electron tomograms of the cell shown to the left. The approximate overlap in field of view of the tomograms is indicated by dashed lines. Note that no NPCs are visible in the stalk part shown in top image. NPCs (indicated by blue arrowheads) are constrained to the midzone (bottom image). Scale bars = 100 nm. Representative of 2 technical repeats. c. Early stage bridge of a dividing cell; same electron tomogram and cell as shown in Figure 2b. Top panel is the segmentation model; white area corresponds to the panels below. Inset slice 1 is a virtual slice through the electron tomogram showing the centres of microtubules, indicated by white arrowheads. Inset slice 2 is 18 nm apart in z and shows a nuclear pore, indicated by blue arrowheads. The NPC thus projects less than 18 nm into the nucleoplasm before encountering the microtubules. 1 technical repeat. Scale bars = 50 nm.

