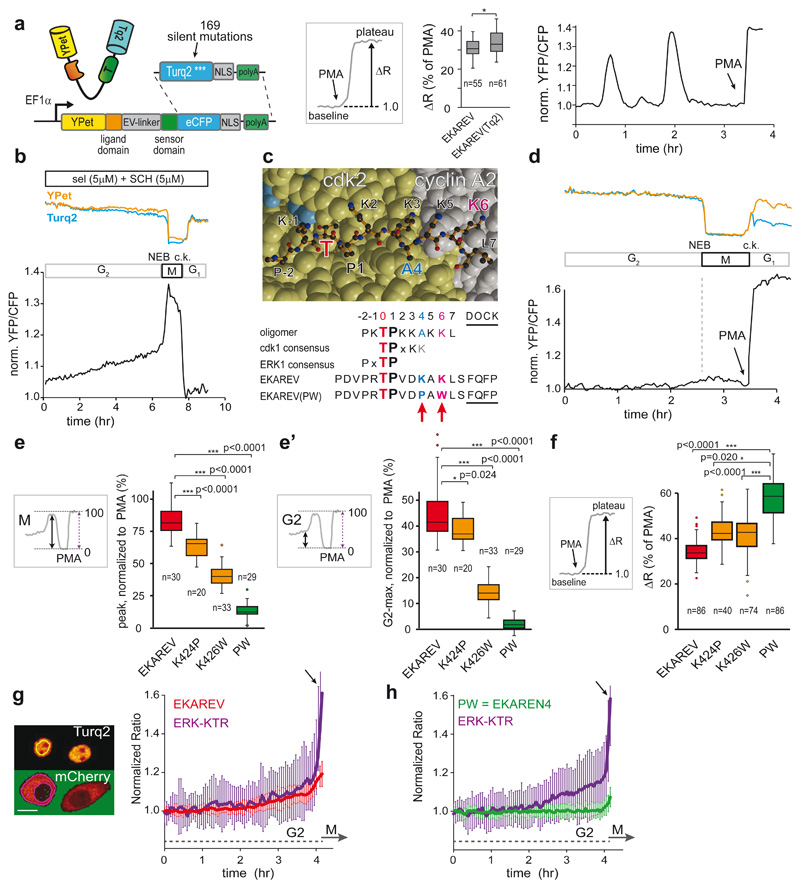
Fig. 1. Minimizing cell cycle-dependent influences on EKAREV(Tq)-FRET.
a, Insertion of Turquoise2 cDNA, including 169 silent mutations (Extended Data Fig. 4a), into EKAREV. FRET range of serum-starved HEK293 cells expressing parental EKAREV (n=55 cells) versus EKAREV(Tq) (n=61), approximated by PMA-induced sensor saturation (ΔR,%)), remained unaffected. 2 independent experiments. Right, EKAREV(Tq) reports spontaneous fluctuations in HeLa cells.
b, Typical mitotic EKAREV profile in HEK293 cells persists under selumetinib (MEKi) and SCH772984 (ERKi) (both 5μM). Blue and yellow traces, Turq2 and YPet fluorescence intensities. Black, ratio YPet/Turq2. Loss of fluorescence indicates Nuclear Envelope Breakdown (NEB). c.k., cytokinesis.
c, Top, crystal structure of CDK2•cyclinA2 complex. CDK2 (yellow) and cyclinA2 (grey), shown as space-filling model and substrate peptide PKTPKKAKKL (orange) in ball-and-stick representation. The structure contains the transition state mimic ADP•AlF3 resembling ATP (blue). Below, sequence comparison of substrate oligomer from the CDK2•cylcinA2 complex, CDK1 and ERK1 consensus, EKAREV sequence and the PW-mutations. Red, threonine for phosphorylation. Blue, mutated Lysine (EKAREV(K424)). Purple, mutated Lysine that interacts with cyclinA2 (EKAREV(K426)). Underlined, ERK-docking site.
d, Representative trace of EKAREV(PW) during G2 and M-phase in HEK293.
e, Quantification of M-phase peaks and e’, maximum FRET signal in late G2, measured in HEK293 cells stably expressing EKAREV or point mutant derivatives. Insets: values were normalized to PMA-induced sensor saturation. p-values calculated from denoted cell numbers (n). 3 independent experiments.
f, Assessing maximal FRET range (ΔR, %) of parental EKAREV(Tq), and mutant derivatives expressed at ‘medium’ levels. p-values calculated from denoted cell numbers (n).
g, Ratiometric traces for FRET and KTR output of monoclonal HeLa cells co-expressing EKAREV(Tq) and ERK-KTR-mCherry biosensors (n=25 cells). Traces were synchronized on mitotic entry and depicted as mean ratio±s.d. Y-axis ratios: FRET (YPF/CFP) and KTR (cytosol/nucleus). Arrow, mitotic entry. Scale bar, 10μm.
h, As in g, but HeLa cells co-expressing EKAREN4 and ERK-KTR-mCherry. p-values calculated from n=26 cells. Shown is mean±s.d.
Two-sided student’s T-tests: *, p<0.05; **, p<0.001; ***, p<0.0005. n.s., non-significant.
For all figures with box-and-whisker plots: boxes represent quartile 2 and 3, horizontal line represents median, whiskers represent minimum and maximum within 1,5x interquartile range. Dots are outliers.

