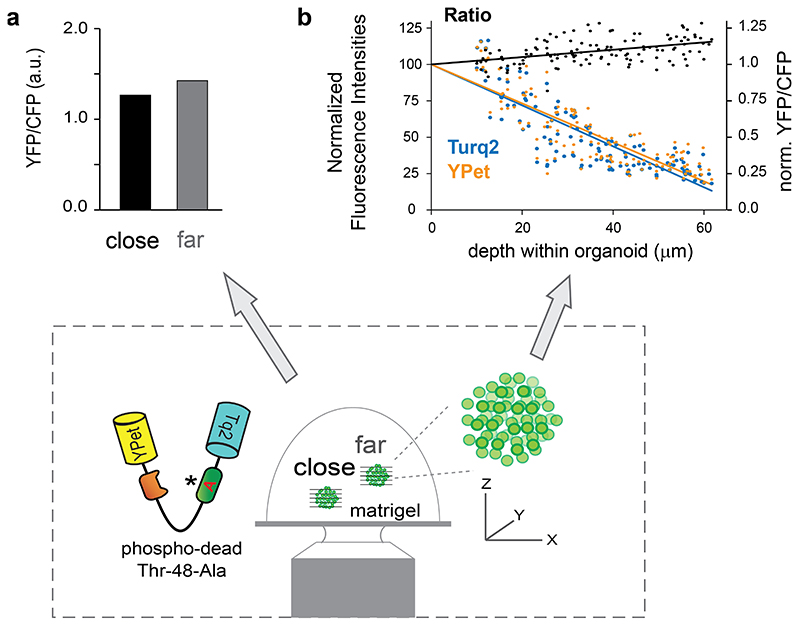
Extended Data Fig. 5. Geometric effects on raw FRET signals in 3D organoid models.
a, PDO model expressing the non-phosphorylatable (hence ERK-insensitive) control sensor EKAREV(TA) was FRET-imaged to assess non-biological geometry effects on raw signals in 3D organoid FRET microscopy. YFP/CFP ratios can differ between organoids situated either far away or close to the objective (distance difference ~150 μm). Experiment performed once, this direct comparison representing general observations.
b, Performing FRET acquisition, Turq2 and YPet emissions were determined from all cells of a bulky organoid (>200 cells) and plotted against their z-coordinates. YFP/CFP ratios increase subtly with increasing depth within the organoid, likely due to differential scattering-induced loss of fluorescence between the two fluorophores. Experiment performed twice with same outcome.

