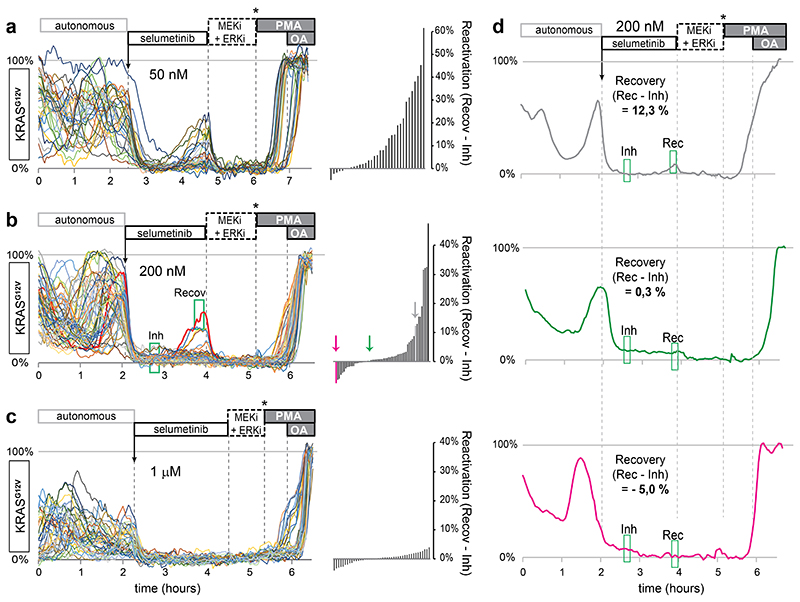
Extended Data Fig. 6. Single-cell ERK responses in organoids to various doses of selumetinib.
a, As in Fig. 3b, here using selumetinib at 50nM concentration. Shown are 33 single-cell analyses from two p9T organoids. Right, waterfall plot summarizing cellular recovery from ERK inhibition (see also Fig. 3b).
b, Exact copy of Fig. 3b, using selumetinib at 200nM concentration. Shown are 59 single-cell analyses from three p9T organoids. Right, waterfall plot summarizing the cellular recovery from ERK inhibition.
c, As in Fig. 3b, here using selumetinib at 1μM concentration. Shown are 42 single-cell analyses from three p9T organoids. Right, waterfall plot summarizing the recovery from ERK inhibition.
d, Three example FRET traces to illustrate the power of time-resolved signal transduction analysis. Trace colours correspond to bars indicated with coloured arrows in waterfall plot of c. Top, cell displaying onset of recovery, interrupted by super-inhibition. Middle, selumetinib-induced inhibition is followed by a sustained phase without apparent recovery. Bottom, inhibitory effect is more prolonged, explaining negative outcome for Recovery (= ‘Recov’ – ‘Inh’). Grey, green and purple colours correspond with bars in waterfall plot of Extended Data Fig. 6b.

