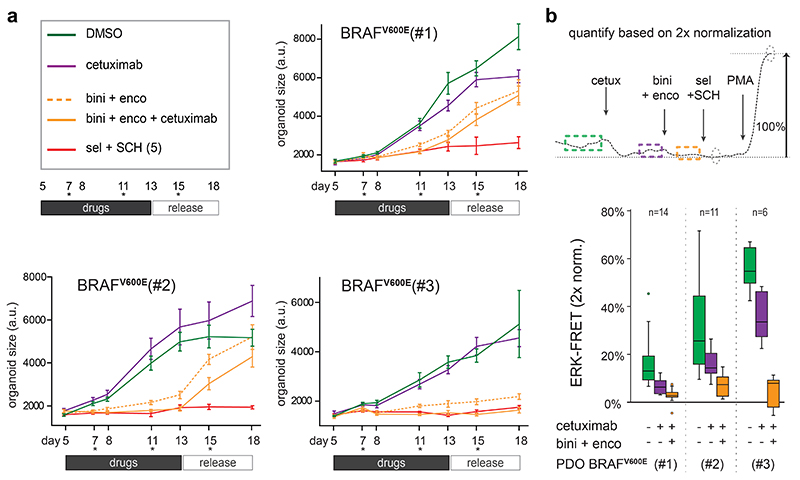
Extended Data Fig. 9. Examining clinical relevant drug therapy on BRAF mutant PDO.
a, Growth assay performed as in Fig. 7c,d, here monitoring the BRAFV600E mutant PDOs #1, #2 and #3 under treatment with drugs from clinical trial by Kopetz et al. (NEJM, 20197). Cetuximab, 1000 ng/ml; binimetinib (MEK-inh), 100nM; encorafenib (BRAF-inh), 300nM. Mean number of objects per time point: BRAFV600E(#1), n=84; BRAFV600E(#2), n=62; BRAFV600E(#3), n=78. For the exact n-numbers of all presented points, see Source Data file. Data are represented as mean size ± s.e.m. Growth medium was supplemented with 200x reduced EGF concentration (0.25 ng/ml) to minimize competition between cetuximab and EGF ligand. Experiment performed once.
b, In same PDO lines, ERK responses were recorded using EKAREN5-FRET. Data are represented as mean value ± s.d. Q uantification scheme based on double calibrated multi-cellular z-plane analyses (n numbers represent PDOs and are indicated in the graph for each group). ERK levels were maximally reduced in presence of triple combination.
Box-and-whisker plots: boxes represent quartile 2 and 3, horizontal line represents median, whiskers represent minimum and maximum within 1,5x interquartile range. Dots are outliers.

