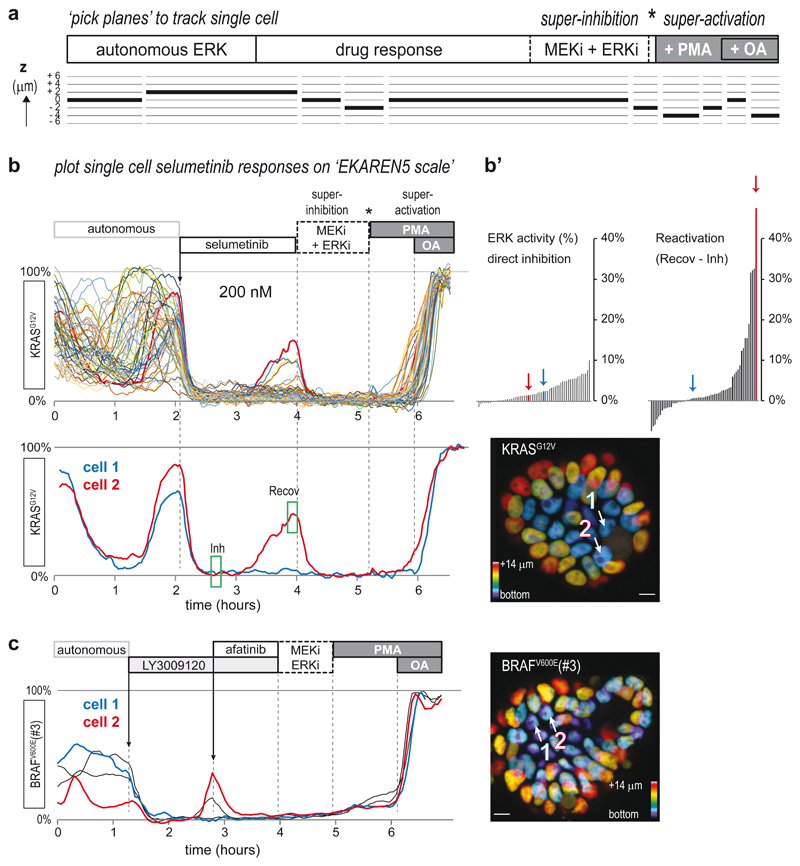
Fig. 3. Single-cell ERK dynamics in CRC PDOs expose cell-to-cell heterogeneity in response to MAPK pathway inhibitors.
a, CRC PDOs expressing the EKAREN5 ERK biosensor were imaged (XYZT) during 8-20 hours with 2-4 minute intervals. At the end of each experiment, minimum and maximum FRET signals were enforced by ‘super-inhibition’ (MEK-inh selumetinib (5μM) and ERK-inh SCH772984 (5μM)) and subsequent ‘super-activation’ (PMA (150nM) and subsequent okadaic acid (OA, 1μM)). Inhibitors were washed out prior to super-activation (asterisk). For bona fide analysis of single-cells moving in 3D, we developed a tool to ‘pick planes’, ensuring that resulting 2D (XYT) excerpts seamlessly follow trajectories of individual cells-of-interest over time, with optimal cross-sectioning of the sensor-filled nuclei (see Methods).
b, Single-cell ERK responses to MEK inhibitor selumetinib (200nM, approximating clinical plasma concentrations43) in EKAREN5-expressing PDO-KRASG12V, imaged and analyzed as outlined in a. Shown are single-cell responses from 59 cells in 3 simultaneously imaged PDOs. Below, exemplary responses of two neighboring cells displaying distinct recovery from ERK inhibition in the course of 2 hours. Corresponding cell 1 and cell 2 are indicated in depth-coded organoid image. See also Supplementary Movie 3. Experiment performed twice.
b’, Waterfall plots summarizing the direct inhibition effect of selumetinib (green box, ‘Inh’) and the recovery effect (difference between green box ‘Inh’ and green box ‘Recov’). Colored bars (arrows) represent cell 1 and cell 2.
c, PDO-BRAFV600E(#3) organoids were subjected to pan-HER inhibitor LY3009120 (1μM). Most cells showed full inhibition (blue), but a subset of cells (red) showed rapid ERK reactivation, sensitive to afatinib (1μM).
Scale bars, 10μm. Experiment performed once.

