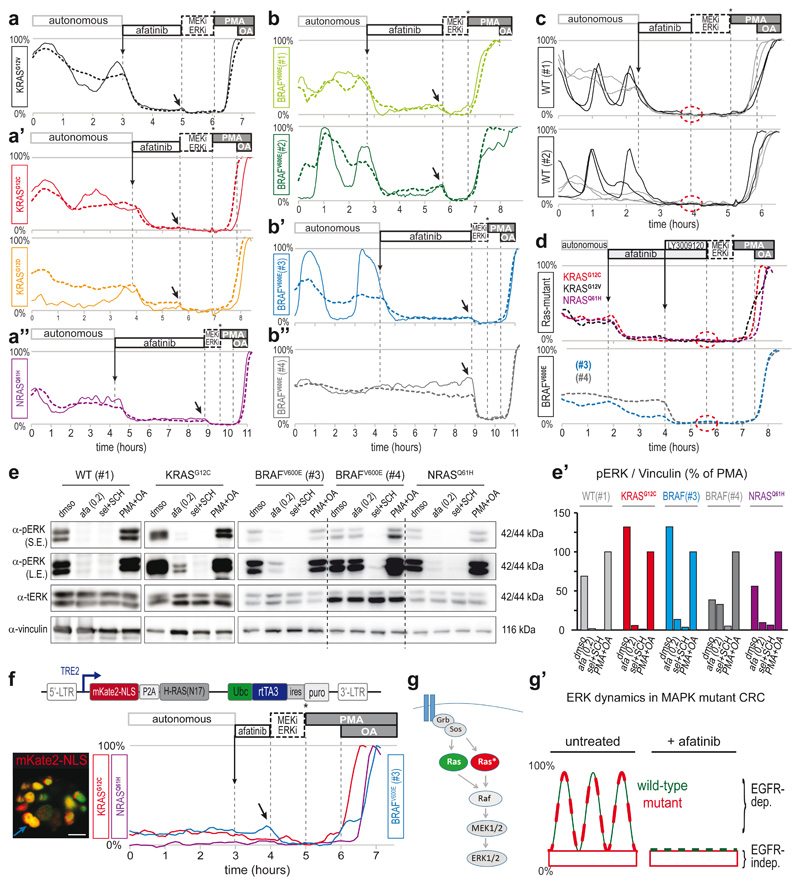
Fig. 4. pan-HER inhibitor afatinib eliminates ERK activity oscillations in KRAS, NRAS or BRAF mutant PDOs.
a-b, EKAREN5 reveals ERK activity in CRC PDOs before and after afatinib administration (200nM). After afatinib-induced ERK suppression, basal ERK level is revealed by further FRET decrease upon super-inhibition (arrow). Unlike other PDOs, BRAFV600E(#4) does not respond to afatinib. Dashed traces, z-plane analyses comprising multiple cells. Solid line, representative single-cell analysis from corresponding z-plane. BRAFV600E(#3) (blue) also as Supplementary Movie 4.
c, As in a. Drug response to afatinib (200nM) in PDO-WT(#1) and (#2). Unlike RAS/BRAF mutant PDOs, afatinib-induced ERK suppression leaves no residual basal levels (dashed circle). Characteristically, dynamics in WT PDOs showed either high-amplitude fluctuations (black) or relatively constant dynamics (grey).
d, Following afatinib-treatment, pan-RAF inhibitor LY3009120 (1μM) abolishes basal ERK activity in KRAS-mutant (top) and BRAF-mutant (bottom) PDOs (dashed circle; no further reduction upon super-inhibition). Shown are z-plane analyses.
e, Western blot analyses on indicated PDO-lines recapitulate above described EKAREN5 observations. In particular, afatinib abolished pERK in PDO-WT(#1), while in mutant PDOs pERK was largely affected, but not abolished. Afatinib (200nM), super-inhibition (sel+SCH, 5μM), super-activation (PMA+OA). S.E., short exposure; L.E., long exposure. Vinculin was used as loading control. Experiment performed twice. Blots for PDO-WT(#1) and PDO-KRASG12C were from experiment also depicted in Extended Data Fig. 7h. e’) Quantification of Western blots in e. pERK signal was normalized to Vinculin signal (relative to maximal induction (PMA+OA)).
f, Doxycyclin-inducible expression of mKate2-NLS-P2A-HRASN17 (top) was generated in PDO-KRASG12C, PDO-NRASQ61H and PDO-BRAFV600E(#3) via lentiviral infection. FRET-acquisition after 20hr of doxycyclin incubation. Analysis on HRASN17-positive cells (marked by mKate2-NLS), reveal loss of oscillatory ERK behavior. Super-inhibition (arrow), but not afatinib could further suppress basal ERK levels. Traces are single-cell analyses. Inset: mKate2-NLS (red) merged with EKAREN5 (green) in BRAFV600E(#3) organoid; blue trace derived from cell indicated by blue arrow. Scale bar, 10μm. Experiment performed once.
g, EGFR employs linear MAPK pathway to induce pulsatile ERK activation, involving both wild-type and mutant KRAS. g’) Model depicting ERK activity patterns in KRASG12X or BRAFV600E mutant PDOs as composites of basal ‘oncogenic’ signaling and EGFR-mediated ERK activity oscillations.

