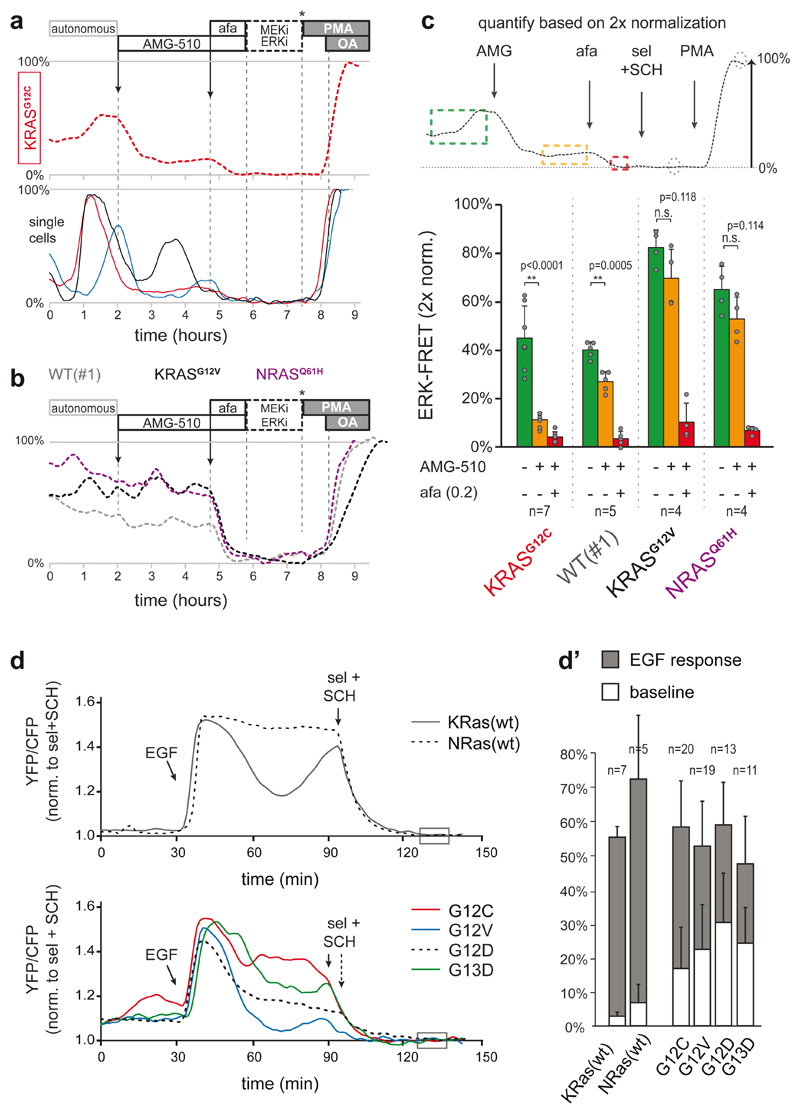
Fig. 5. Mutant KRAS molecules engage in EGFR-mediated ERK activation.
a, KRASG12C was specifically targeted by AMG-510 (250nM) in PDO-KRASG12C, inducing substantial suppression of ERK activity. Top, plane-analysis; bottom, single cells from same organoid. Unlike in afatinib responses (e.g. Fig. 4a), residual ERK activity remains characterized by pulsatile dynamics (of various amplitude), likely representing EGFR activity relayed by the unhindered wild-type RAS proteins.
b, Three CRC PDOs containing either wild-type or different RAS mutants were scanned in parallel, excluding non-specific effects of AMG-510 (250nM) on ERK signaling. Shown are plane-analyses.
c, Top, scheme for the analysis of EKAREN5 dynamics before and after drug administration on a double calibrated scale. Bottom, bar graph summarizes PDO responses before (green), to AMG-510 (orange) and to AMG-510 + afatinib (200nM) (red). Data presented as mean values ± s.d. N numbers represent individual PDOs (see individual data points) and are stated in the graph for each group.
Representative traces in a and b. Experiment performed twice. Two-sided student’s T-test: *, p<0.05. n.s., non-significant.
d, EKAREN5 was introduced into RASless MEFs harbouring RAS reconstitutions, being wild-type (top) or either of four mutants (bottom). The MEFs sister lines were serum-starved 24 hours prior to EGF stimulation, clearly indicating amplified signal transduction by mutant RAS upon EGFR activity. FRET-signal is normalized to super-inhibition (box). d’, Quantification of all single cell analyses. n numbers represent cells and are denoted in the graph for each group. Data presented as mean values ± s.d.

