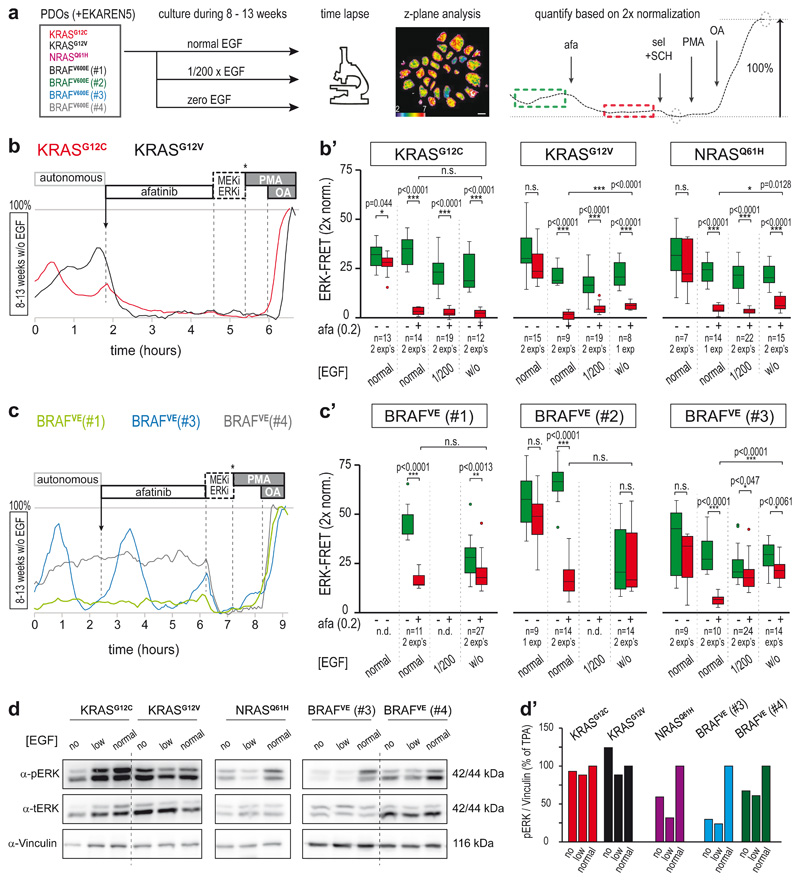
Fig. 6. Differential adaptation to long-term growth conditions without EGF.
a, Culturing scheme to assess the role of EGF supplementation to the PDO culture medium. PDOs were cultured in medium containing standard EGF (50 ng/ml), 200x diluted EGF (0.25 ng/ml) or no EGF. After 8-13 weeks, PDOs were FRET-imaged during afatinib treatment (200nM) and z-plane analysis was performed (example FRET image shows ROI definition in purple). Right, example trace (representative for n>10): green dashed box, mean ERK before treatment; red dashed box, mean ERK after treatment. Afatinib-induced ERK suppression was quantified according to double calibration (circles: ERKmin and ERKmax). Scale bar, 10μm.
b, After 8-13 weeks of culturing without EGF supplementation, the persistent ERK activity oscillations in PDO-KRASG12C (red) and PDO-KRASG12V (black) showed sensitivity to afatinib. Shown are representative single-cell analyses. b’) Effects of pan-HER inhibition on ERK activity levels, quantification as outlined in a. Green, before afatinib; red, after mock or afatinib (200nM) inhibition Indicated are PDO numbers (n), pooled from one or two experiments (exp).
c, As in b, single-cell ERK traces from three PDO-BRAFV600E mutant PDOs cultured without EGF. ERK dynamics in BRAFV600E(#1) are now without oscillations. While BRAFV600E(#3) (blue) still shows oscillatory ERK dynamics, the majority of cells has become unresponsive to afatinib. BRAFV600E(#4) (grey) remains insensitive to afatinib. c’) Effects of pan-HER inhibition on ERK activity levels, quantification as outlined in a. Green, before afatinib; red, after mock or afatinib (200nM) inhibition. PDO numbers (n) as indicated. Experiment was performed at least twice (each comprising 10-25 organoids).
b’,c’, boxes represent quartile 2 and 3, horizontal line represents median, whiskers represent minimum and maximum within 1,5x interquartile range. Dots are outliers. Two-sided student’s T-tests: *, p<0.05; **, p<0.005; ***, p<0.0005. n.s., non-significant.
d, Western blot analysis of ERK activity status in PDO lines. ‘Low’, 200x reduced EGF (0.25 ng/ml) supplementation. ‘No’, without EGF supplementation. Vinculin was used as a loading control. Left, RAS mutant PDO lines; right, BRAFV600E mutant PDO lines. Experiment performed once. d’), Quantifications of d.

