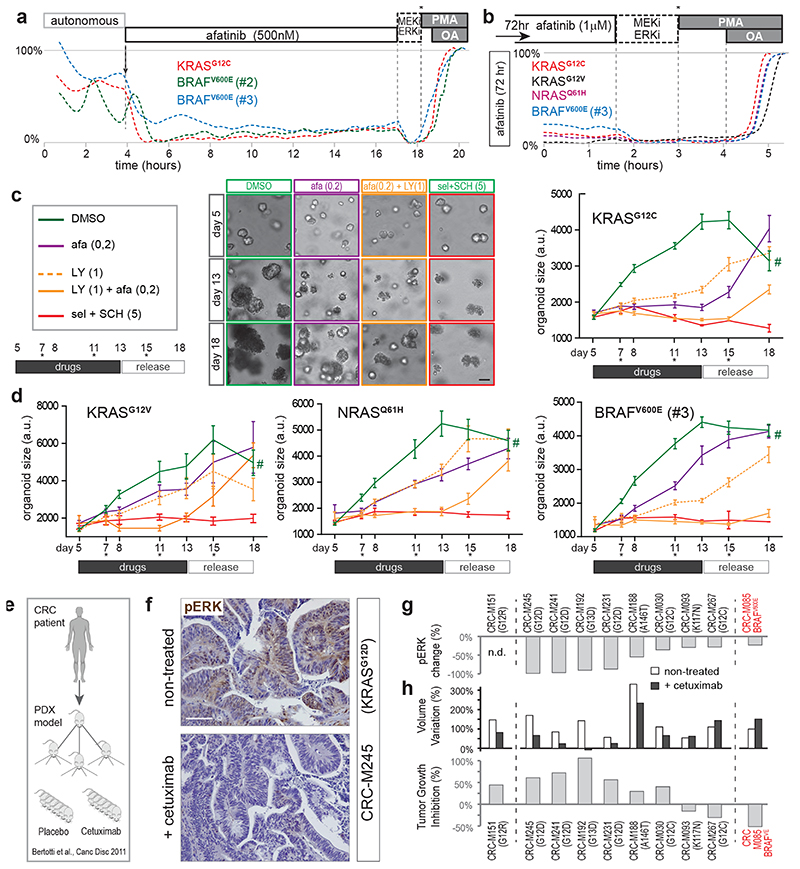
Fig. 7. EGFR-mediated amplification of ERK signaling promotes tumor growth in vitro and in vivo .
a, Representative FRET-traces (z-plane analyses) of EKAREN5 post afatinib treatment in KRASG12C, BRAFV600E(#2) and BRAFV600E(#3) shows sustained absence of EGFR-mediated amplification.
b, As in a, but FRET-imaging initiated 72hr post afatinib treatment. Basal ERK levels remain unaltered during long-term drug response.
c, Monitoring organoid growth of 5-day old PDO-KRASG12C during 8 days drug treatment, followed by 5 days without drugs to test growth re-initiation of viable organoids (asterisks, medium refreshments). Drug concentrations (μM) denoted. Representative brightfield images at days 5, 13 and 18. Right, EKAREN5 YPet fluorescence was used for object segmentation for size measurement (~103 PDOs per data point), depicted in corresponding graphs (mean ± s.e.m.). Experiment performed twice. Scale bar, 50μm. #, unreliable measurement (overgrowth) of 18 day-old DMSO-treated PDOs.
d, As c, graphs depicting mean organoid size (+/-s.e.m.) during drug treatment on KRASG12V, NRASQ61H and BRAFV600E(#3) PDOs. Experiment performed twice. Mean number of objects (PDOs) per time point: KRASG12V, 59; NRASQ61H, 84; BRAFV600E(#3), 107.
c,d, for exact n-numbers per presented data point, see Source Data.
e-h, Frozen sections were taken from experiments performed for Bertotti et al.50.
e, Schematic of PDX model generation from metastatic CRC samples50 for prospective examination of cetuximab response.
f, Changes in pERK levels were scored through immunohistochemistry on paraffin-embedded tumor sections after 2 weeks of cetuximab or placebo treatment in three independent mice bearing PDX from same tumor. Shown are representative sections from KRASG12D-mutant PDX model M245, illustrating strong reduction in pERK levels following cetuximab-treatment. Scale bar, 100 μm.
g, Graph depicting quantified changes in pERK levels for 9 out of 10 PDX models of CRC (oncogenic mutations denoted). Changes in pERK levels were scored through immunohistochemistry as the average of 10 optical fields (40X), randomly chosen from each tumor (n=30). Minimally 2 mice per group were analyzed.
h, Comparative re-analysis of tumor growth data per PDX model upon treatment with cetuximab (n=6 mice) or placebo (6 mice)50. Top, bar graph representing tumor size variation from baseline of untreated and cetuximab-treated animals. Bottom, bar graph representing tumor growth inhibition (%,treated/untreated) calculated from size variation.

