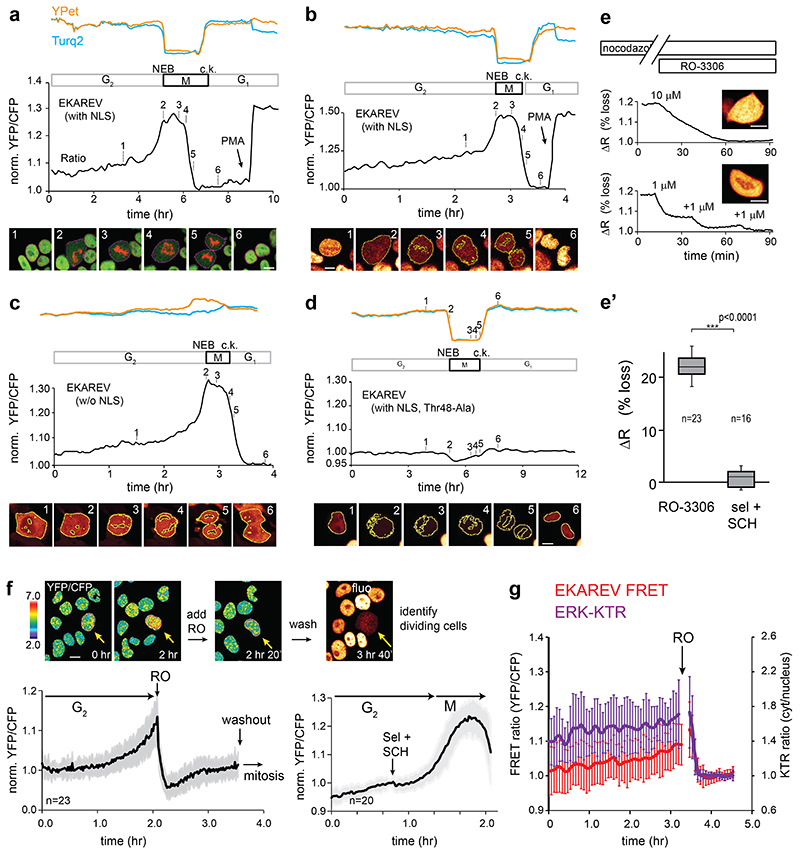
Extended Data Fig. 1. CDK1/cyclinB phosphorylates EKAREV(Tq) during G2- and M-phase.
a, Typical mitotic EKAREV-FRET profile in HEK293 cells, including rising phase, steep increase at nuclear envelope breakdown (NEB) and sharp decline at anaphase (Supplementary Movie 1.) Corresponding snapshots of above cells with H2B-mScarlet support cell-cycle phases (20 cells; 1 experiment). 1, G2; 2, NEB; 3, metaphase; 4, anaphase; 5, cytokinesis (c.k.); 6, G1. FRET-signal relative to PMA saturation (150nM). Black, FRET-ratio of YPet(yellow)/Turq2(blue) intensities.
b, As a, with cell-cycle stages recognized by EKAREV(Tq) biosensor exclusion from condensed chromosomes; consistently observed (53 cells, 4 experiments).
c, As a, but EKAREV(Tq) biosensor lacking nuclear localization. Observed in 28 cells, 2 experiments.
d, As a, but EKAREV(TA) control biosensor that cannot be phosphorylated. Observed in 5 cells, 1 experiment.
e, EKAREV(Tq) FRET signal in mitotic arrested HEK293 cells (nocodazol, 0.83μM; 2hrs) is sensitive to CDK1 inhibitor RO-3306. In mitotic cells, recognized by absence of nuclear localization (NEB) of NLS-tagged biosensor (insert images), FRET decreased upon 10μM RO-3306 (9 cells; 2 experiments with similar results), or 3x 1μM (1 cell). e’, Loss of normalized FRET signal (ΔR, %) upon RO-3306 (10μM) or MAPK pathway inhibitors (sel+SCH, 5μM each). Box-and-whisker plots: boxes represent quartile 2 and 3, horizontal line represents median, whiskers represent minimum and maximum within 1,5x interquartile range. RO-3306: n=23 cells, sel+SCH n=16 cells.
f, EKAREV(Tq) FRET signal is sensitive to CDK1-inhibition in G2-phase. Synchronized cells were imaged before, during and after incubation with RO-3306 (10μM) and retrospectively analyzed if mitotic entry was observed <15 minutes after drug washout (n=23 cells). Right, similar experiment, here inhibiting MEK and ERK (n=20 cells). Graph shows mean±s.d. of baseline-normalized traces.
g, As f, monitoring G2-phase in HeLa cells (n=19) co-expressing ERK-KTR-mCherry and EKAREV(Tq). ERK-KTR biosensor suffers from same undesired CDK1-sensitivity.
***, two-sided student’s T-test, p<0.0005. Scale bar, 10μm.

