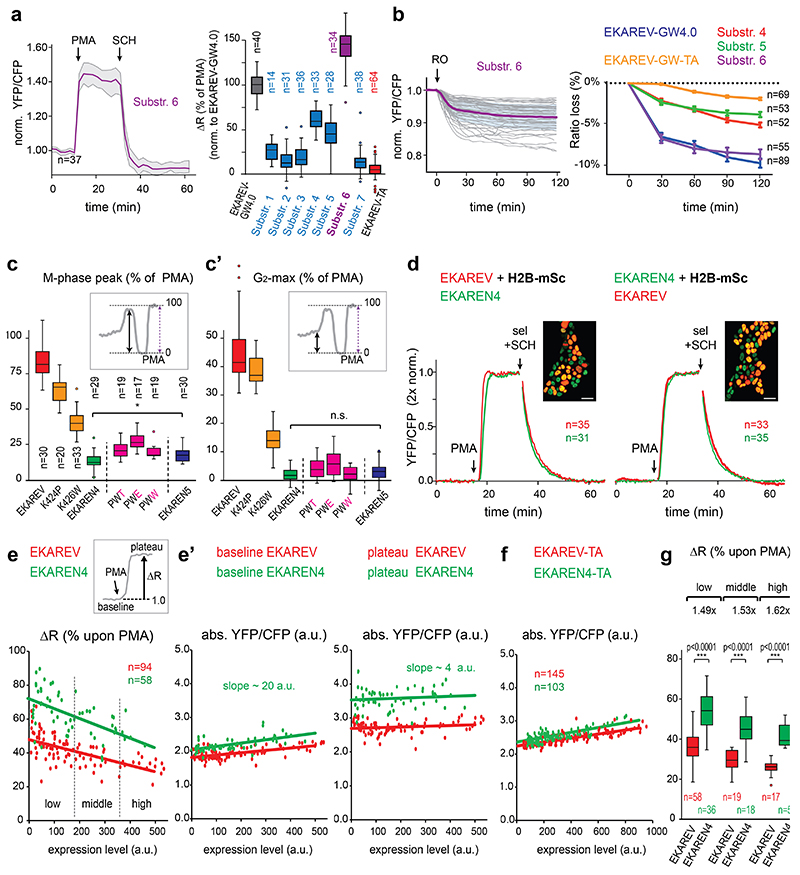
Extended Data Fig. 2. Improving ERK specificity, generating EKAREN4.
a, HeLa cells expressing EKAREV substrate variants Alt_ERK_Substr_1-6 (Extended Data Fig. 4b). PMA, 500nM; SCH, 10μM. Right, responses (mean±s.d.), normalized to EKAREV-GW4.0.
b, HeLa cells expressing EKAREV-GW variants were arrested in mitosis (Extended Data Fig. 1e) to test CDK1/cyclinB sensitivity (RO-3306). Purple, mean of individual traces. Right, overview for several variants, mean ratio loss ± s.e.m. Best responder EKAREV-GW(Alt_substr._6) is compromised by RO-sensitivity.
c, Repeat of Fig. 1e, quantifying FRET in G2- and M-phase HEK293 cells (mean ± s.d), complemented with results from third-residue-substitution variants (purple). No improvements compared to EKAREN4/EKAREN5.
d, Sensor dephosphorylation kinetics, assessed by instant ERK inactivation (sel+SCH, 5μM) after initial sensor saturation (PMA). For identical experimental conditions, HEK293 stably expressing EKAREV(Tq) or EKAREN4 were mixed. H2B-mScarlet selectively marked EKAREV(Tq) (left) or EKAREN4 cells (right) (insets: scale, 25μm). Cells analyzed individually and averaged after double normalization (baseline and PMA-plateau).
e, Maximum FRET range (ΔR(%), approximated through saturation (PMA) in serum-starved HEK293 cells of widely variable expression levels. e’, Baseline and plateau ratios corresponding to cells in e. Increased FRET range of EKAREN4 likely results from elevated plateau ratios. Expression levels affect FRET range by differentially affecting baseline ratios (see slopes in a.u.). Experiment performed twice.
f, As e, differential effect of expression level on FRET range is similar for ERK-insensitive control sensors EKAREV(TA) and EKAREN4(TA).
g, Mean (± s.d.) ΔR per expression level category (see e). For panels a-g the n numbers represent cells and are indicated in the graph for each group. Box-and-whiskers: boxes represent quartile 2 and 3, horizontal line represents median, whiskers represent minimum and maximum within 1,5x interquartile range. Dots are outliers. P values in all relevant panels were calculated using a two-sided student’s T-test, * p<0.05; ***, p<0.0005. n.s., non-significant.

