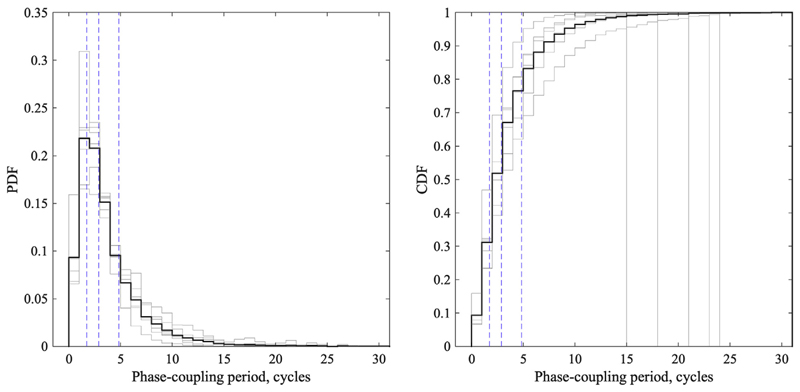
Fig. 1.
Mean probability density function (PDF) and cumulative distribution function (CDF) estimates of phase-coupling periods in the interhemispheric M1-M1 network, pooled from all subjects (n = 6, thick black curves). PDF describes the probability for a random sample to be part of a phase-coupling period of length n. CDF describes the probability that a random sample is part of a phase-coupling period less or equal to n. The individual data are shown as thin grey curves. Phase-coupling periods are indicated as number of cycles at the individual μ-peak frequency. Vertical dashed blue lines indicate 0.25, 0.5, and 0.75 quartiles of the distribution.

