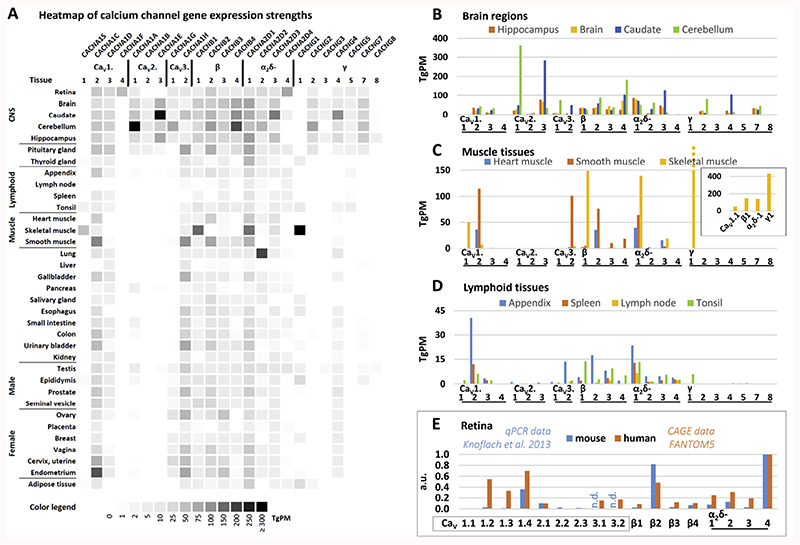
Fig. 2. VGCC gene expression in different human tissues and mouse retina.
(A) Heatmap of VGCC gene expression strengths across tissues. Darker hues indicate higher expression (TgPM = tags per million). Because the HPA dataset contained only a part of the brain (cerebral cortex) and no retinal samples, we chose FANTOM5 data for this comparison which were shown to highly correlate with the HPA (Yu et al., 2015b). Note that CaV3.3 and γ6 data was not available from FANTOM5 and using another database for the comparison of absolute values was not possible. (B) Expression of VGCCs in different brain regions. Note that “Brain” is a whole-brain sample. (C) Expression of VGCCs in muscle tissue. The inset shows the skeletal muscle calcium channel subunit encoding genes. Note the high abundance of γ1. (D) Expression of VGCCs in lymphoid tissues (E) Comparison of expression of VGCC in mouse and human retina. Data were normalized to α2δ-4. FANTOM5 data was retrieved through Human Protein Atlas website www.proteinatlas.org on 11.01.2017. VGCC nomenclature according to Catterall et al. (2005).

