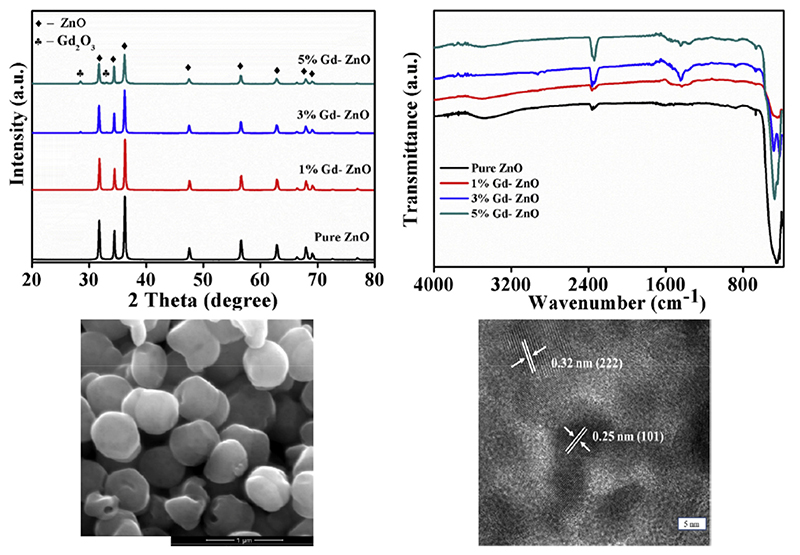
Figure 4.
Characterization of gadolinium-doped ZnO nanoparticles. From left to right and top to bottom: XRD patterns and Fourier transform infrared spectroscopy (IrTIR) spectra of the nanostructures at different doping levels, scanning electron microscope and transmission electron microscope images of 3% Gd-doped ZnO nanoparticles. Adapted from ref. [177].

