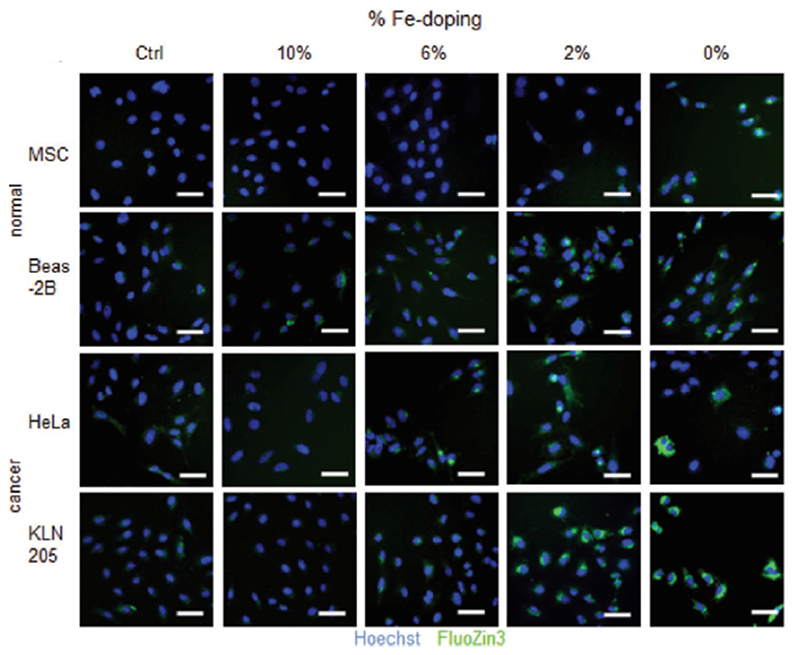
Figure 8.
Fluorescence microscopy images of different cell lines exposed to differently Fe-doped ZnO nanoparticles (no nanoparticles (NPs) are present in the control samples). The green signal is related to Zn2+ free ions (FluoZin3-AM binds to ions and have a green fluorescent emission), the blue signal is related to the presence of cell nuclei. Less doped ZnO nanoparticles lead to a higher concentration of free zinc ions. Adapted from ref. [204].

