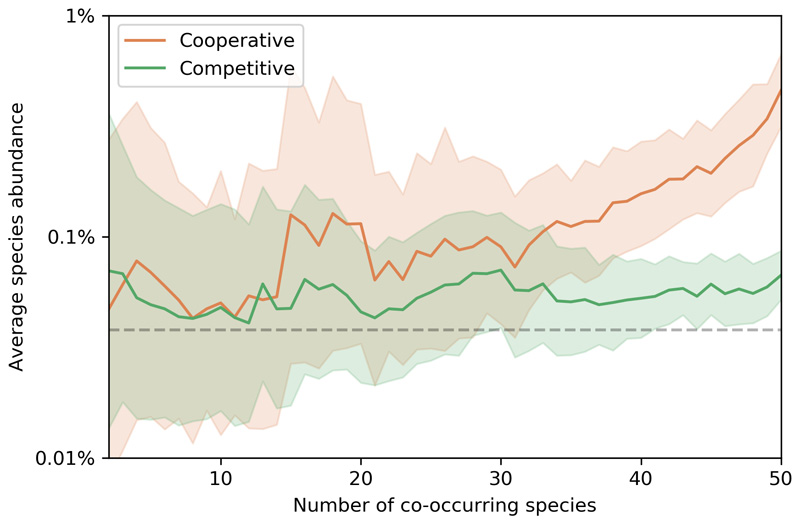
Extended Data Fig. 5. Abundance of co-occurring species as a function of the total number of co-occurring partners present in a sample.
The colored line denotes the average abundance for each type of community, the shadowed area indicates standard deviation, and the dashed grey line indicates the average species abundance across all species and samples (in all cases the average is calculated as the mean value in log-space, i.e. representing the geometric mean of the relative abundance values).

