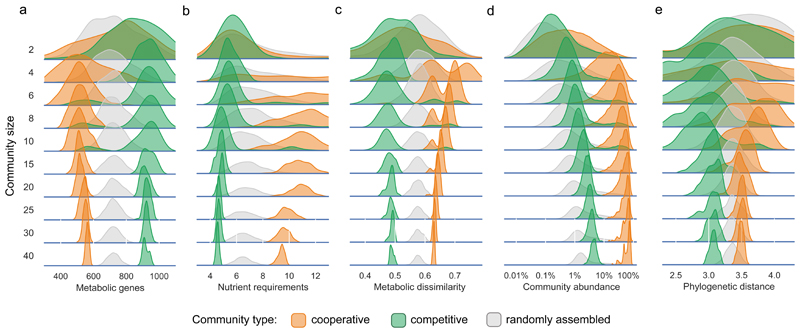
Figure 2. Members of the cooperative and competitive communities show distinct genomic and phylogenetic characteristics, and have different abundance profiles.
Shown are the distributions of: a) the number of metabolic genes; b) the number of nutrients required (discounting non-organic compounds); c) the dissimilarity (Jaccard distance) between the metabolic networks of all species pairs; d) the abundance of community members across all the samples wherein the community occurs. The random assemblies in this case correspond to random subcommunities of equal size taken from the same samples; e) phylogenetic distance between all pairs of species within each community type. Each curve represents 1000 communities of a given size and community type.

