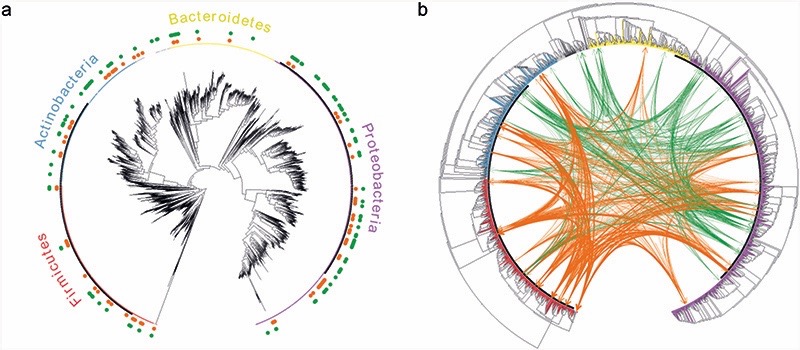
Figure 4. Members of both competitive and cooperative communities are observed across the four main phyla.
Shown are the phylogenetic trees for all the species in the EMP dataset that could be mapped to reference genomes (2986 species in total). a) distribution of competitive (green) and cooperative (orange) species across the four main phyla; b) predicted cross-feeding interactions between the 50 most frequently occurring species in competitive (green) and cooperative (orange) communities. The edge width represents the SMETANA score for each interaction (indicating the frequency and total number of exchanged compounds).

