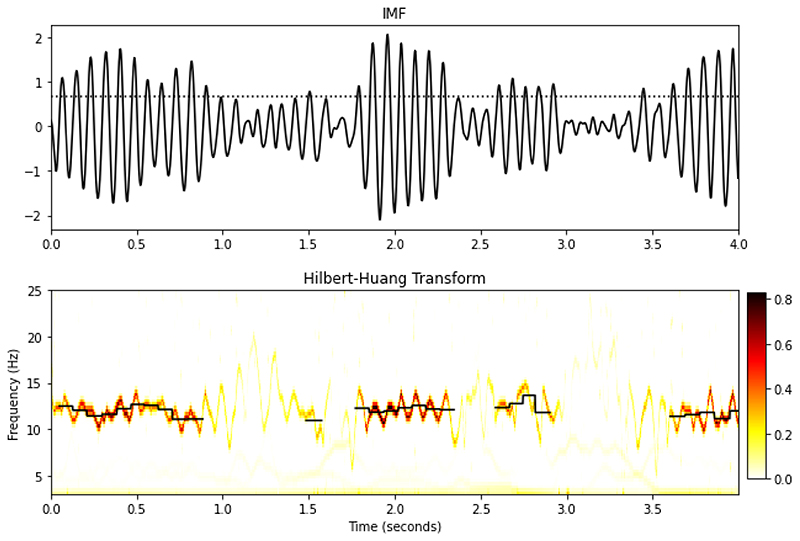
Figure 3.
Top panel: An Instrinsic Mode function from a simulated signal (black line) and an amplitude threshold (dotted line). Bottom Panel: 2D Hilbert-Huang Transform. Darker colours indicate greater power and the black lines indicate cycle average instantaneous frequency of large amplitude cycles.

