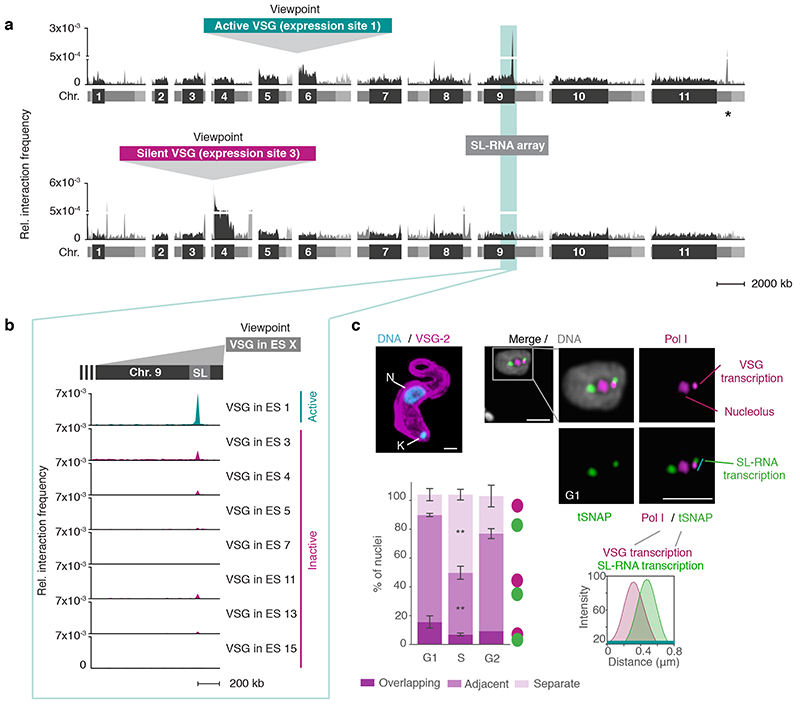
Fig. 1. The active VSG expression site (ES) stably interacts with the spliced leader RNA (SL) array.
a, Hi-C (virtual 4C) analysis, viewpoints: active VSG gene in ES 1 (VSG-2, top panel) and silent VSG gene in ES 3 (VSG-6, bottom panel). Relative interaction frequencies between the viewpoint and the 11 megabase chromosomes are shown. Chromosome cores, dark grey; subtelomeric regions, light grey. The hemizygous subtelomeric regions are displayed in the following order: 5′(haplotype A)–5′(haplotype B)–diploid chromosome core–3′(haplotype A)–3′(haplotype B). Bin size 50 kb. * marks the centromere on chr. 11. The coordinates of all viewpoints used for virtual 4C analyses are listed in Supplementary Information sheet 2. b, Virtual 4C analysis, viewpoints: active VSG gene in ES 1 and inactive VSG genes in ES 3, 4, 5, 7, 11, 13 and 15. Relative interaction frequencies between the viewpoint and the SL-RNA locus on the right arm of chr. 9 is plotted. Bin size 20 kb. The analyses in a-b are based on Hi-C experiments with VSG-2 expressing cells (n=2, average interaction frequencies are shown). c, Immunofluorescence-based colocalization studies of tSNAPmyc (SL-RNA locus marker – SL-RNA transcription compartment) and a nucleolar and active-VSG transcription compartment marker (Pol I, largest subunit) using super resolution microscopy. The stacked bar graph depicts proportions of G1, S phase or G2 nuclei with overlapping, adjacent or separate signals for the SL-RNA and VSG transcription compartments (these categories were defined by thresholded Pearson’s correlation coefficients – see methods). A two-tailed paired Student’s t-test was used to compare S or G2 nuclei versus G1 nuclei; statistical significance is highlighted where applicable: **, p < 0.01. Values are averages of three independent experiments and representative of two independent biological replicates (≥100 nuclei); error bars, SD. Detailed n and p values are provided in Source Data Fig. 1. DNA was counter-stained with DAPI; the images correspond to maximal 3D projections of stacks of 0.1 μm slices; scale bars 2 μm. N, nucleus; K, kinetoplast (mitochondrial genome).

