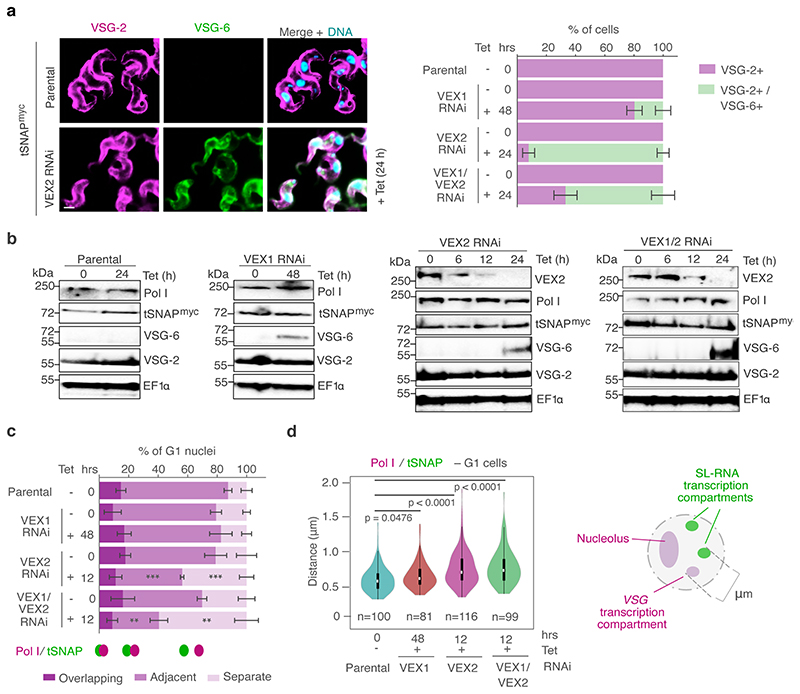
Extended Data Fig. 6. Pol I and tSNAP expression and localization following knockdown of the VEX complex.
a, Immunofluorescence-based analysis of VSG expression following tetracycline (Tet) inducible VEX1 knockdown, VEX2 knockdown or VEX1/VEX2 knockdown. In unperturbed cells (parental strain), VSG-2 (magenta) is the active VSG and VSG-6 (green) is a silent VSG used to monitor derepression. The stacked bar graph depicts percentages of VSG-2 single positive cells and VSG-2/VSG-6 double positive cells; values are averages of two independent experiments and two biological replicates. DNA was counter-stained with DAPI; scale bar 2 μm. b, Western-blot analysis of VEX2, Pol I, tSNAPmyc, VSG-6 and VSG-2 expression following VEX1, VEX2 or VEX1/VEX2 knockdown. EF1α was used as a loading control. The data is representative of two independent experiments and two biological replicates. c-d, Immunofluorescence-based colocalization studies of tSNAPmyc (SL-RNA transcription compartment) and Pol I (nucleolus and extranucleolar reservoir). The stacked bar graph in c depicts proportions of G1 nuclei with tSNAPmyc / Pol I overlapping, adjacent or separate signals (these categories were defined by thresholded Pearson’s correlation coefficient – see methods) following tetracycline (Tet) inducible VEX1 (48 h), VEX2 (12 h) or VEX1/VEX2 knockdown (12 h). tSNAPmyc / extranucleolar Pol I localization were not monitored beyond 12 h following VEX2 and VEX1/2 knockdown as Pol I signal drops below detection at later time-points. The values are averages of two independent experiments and two biological replicates (≥100 G1 nuclei). In the violin plot in d, the ‘outside edge’ distance between the Pol I extranucleolar focus and tSNAP foci was measured in > 81 G1 nuclei. White circles show the medians; box limits indicate the 25th and 75th percentiles; whiskers extend 1.5 times the interquartile range from the 25th and 75th percentiles; polygons represent density estimates of data and extend to extreme values. In a/c, error bars, SD. In c-d, knockdown conditions were compared to parental cells using two-tailed paired (c) or unpaired (d) Student’s t-tests; in c, statistical significance is highlighted when applicable: **, p < 0.01; ***, p < 0.001. Uncropped blots (b) and detailed n and p values (c/d) are provided in Source Data Extended Data Fig. 6.

