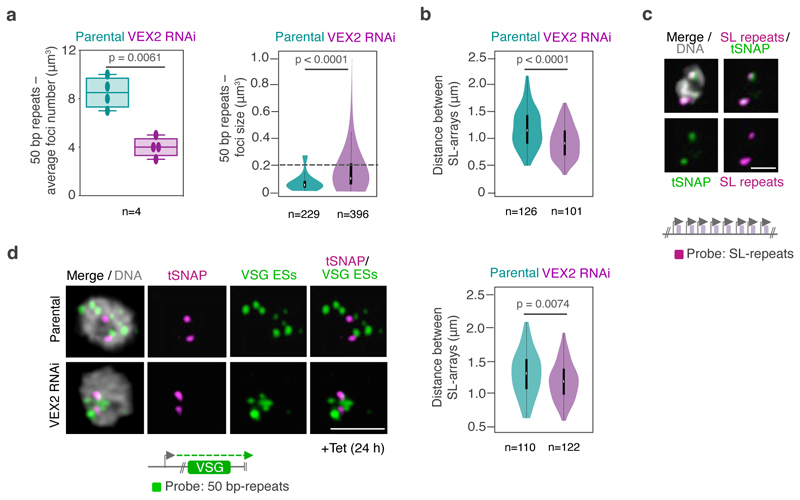
Extended Data Fig. 7. The exclusive association between the active VSG and the SL-locus is VEX2-dependent.
a-b, DNA fluorescence in situ hybridization (FISH) and super resolution microscopy based colocalization studies of the SL-RNA transcription compartments (probe: digoxigenin labeled SL repeats) and VSG expression sites (probe: biotin-labeled 50 bp repeats) following VEX2 knockdown. a, the box and violin plots depict the average number and the size of the 50 bp repeats foci, respectively, before and after VEX2 knockdown. b, the violin plot represents the distance between both SL-arrays (before and after VEX2 knockdown. c-d, DNA FISH combined with immunofluorescence colocalization studies of the SL-RNA transcription compartments and VSG expression sites before and after VEX2 knockdown using super resolution microscopy. tSNAPmyc (protein marker) and a DNA probe for the SL repeats (biotin-labeled) or DNA probes for the 50 bp repeats (VSG ESs, biotin labeled) were used (c and d, respectively). The violin plot (d) represents the distance between both tSNAP foci before and after VEX2 knockdown. For all violin plots: white circles show the medians; box limits indicate the 25th and 75th percentiles; whiskers extend 1.5 times the interquartile range from the 25th and 75th percentiles; polygons represent density estimates of data and extend to extreme values. For the box plot in a, centerlines show the medians; box limits indicate the 25th and 75th percentiles whiskers extend between the minimum and maximum values. Two-tailed paired (a, left hand side) or unpaired Student’s t-tests (a, right hand side; b,d) were applied for statistical analysis. Detailed n and p values are provided in Source Data Extended Data Fig. 7. Representative images (c-d): all nuclei are G1; images correspond to maximal 3D projections of stacks of 0.1 μm slices; DNA was counter-stained with DAPI; scale bars 2 μm. The data correspond to (a, box plot) or are representative of (a, violin plot & b-d) two biological replicates and two independent experiments.

